Fig. 13
Download original image
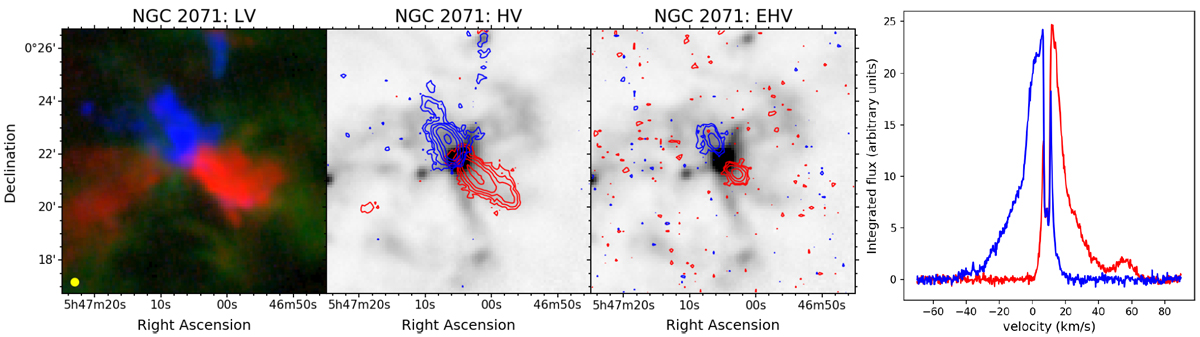
Maps and spectra of the NGC 2071 molecular outflow. The leftmost panel shows the low velocity component of the outflow (red:v = +13 to +20 km s−1, blue: v = −5 to +5 km s−1) along with CO emission around the clouds rest velocity (green: v = +6 to +12 km s−1). The yellow dot indicates the beam size. The two central panels show contour plots of the high-velocity (HV) emission (red: v = +21 to +44 km s−1, blue: v = −25 to −6 km s−1) and extremely high-velocity (EHV) emission (red: v = +45 to +67 km s−1, blue: v = −41 to − 26 km s−1); the greyscaleshows APEX Laboca 870 μm dust continuum emission. The panel to the right shows spectra extracted over a 12′′ radius on the peak position of the EHV emission component, showing a well separated EHV feature particularly in the red lobe.
Current usage metrics show cumulative count of Article Views (full-text article views including HTML views, PDF and ePub downloads, according to the available data) and Abstracts Views on Vision4Press platform.
Data correspond to usage on the plateform after 2015. The current usage metrics is available 48-96 hours after online publication and is updated daily on week days.
Initial download of the metrics may take a while.