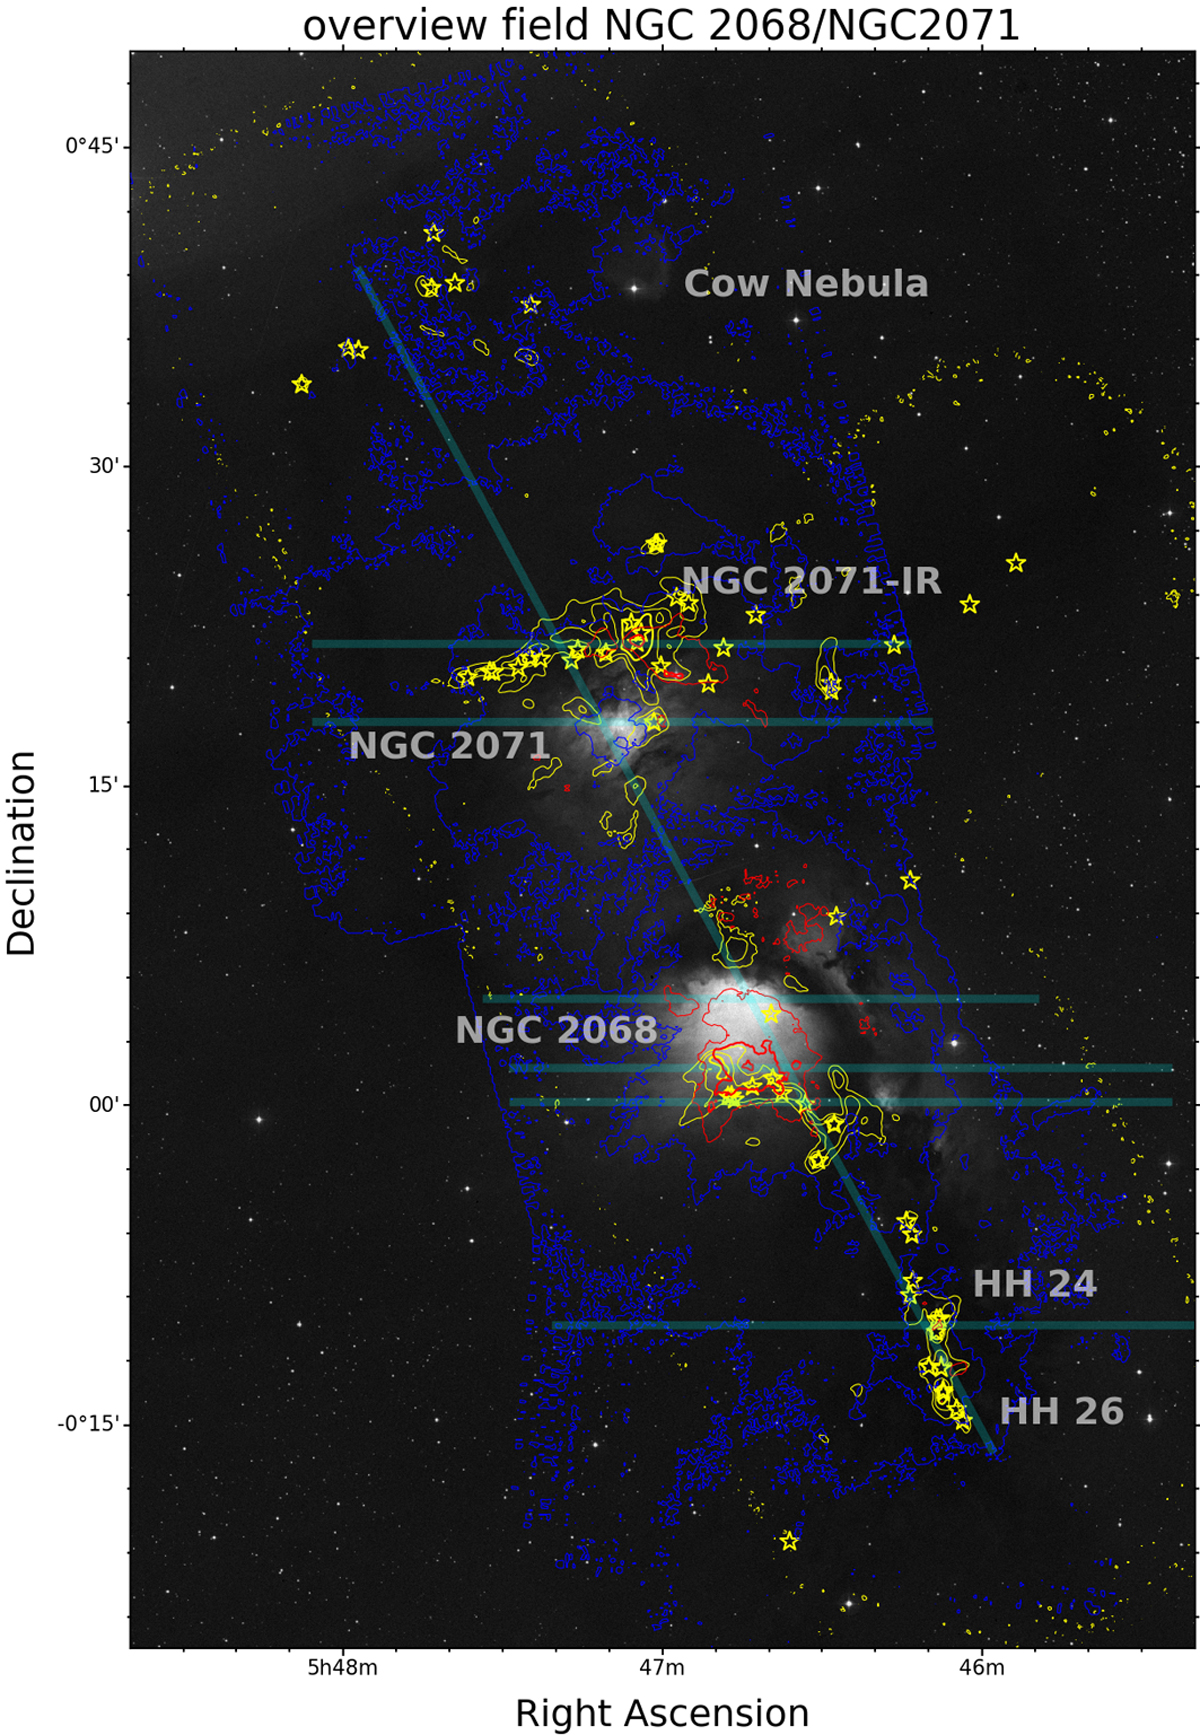
Fig. 11
Download original image
Overview of the NGC 2068 & NGC 2071 region, showing a DSS2-blue optical image of the region, with the integrated CO emission from Fig. 10 overplotted as blue and red (for the brightest regions) contours, and APEX Laboca 870 μm dust continuum as yellow contours. Yellow stars mark the position of HOPS protostars, and cyan lines mark the location of the position-velocity cuts shown in Fig. 12.
Current usage metrics show cumulative count of Article Views (full-text article views including HTML views, PDF and ePub downloads, according to the available data) and Abstracts Views on Vision4Press platform.
Data correspond to usage on the plateform after 2015. The current usage metrics is available 48-96 hours after online publication and is updated daily on week days.
Initial download of the metrics may take a while.