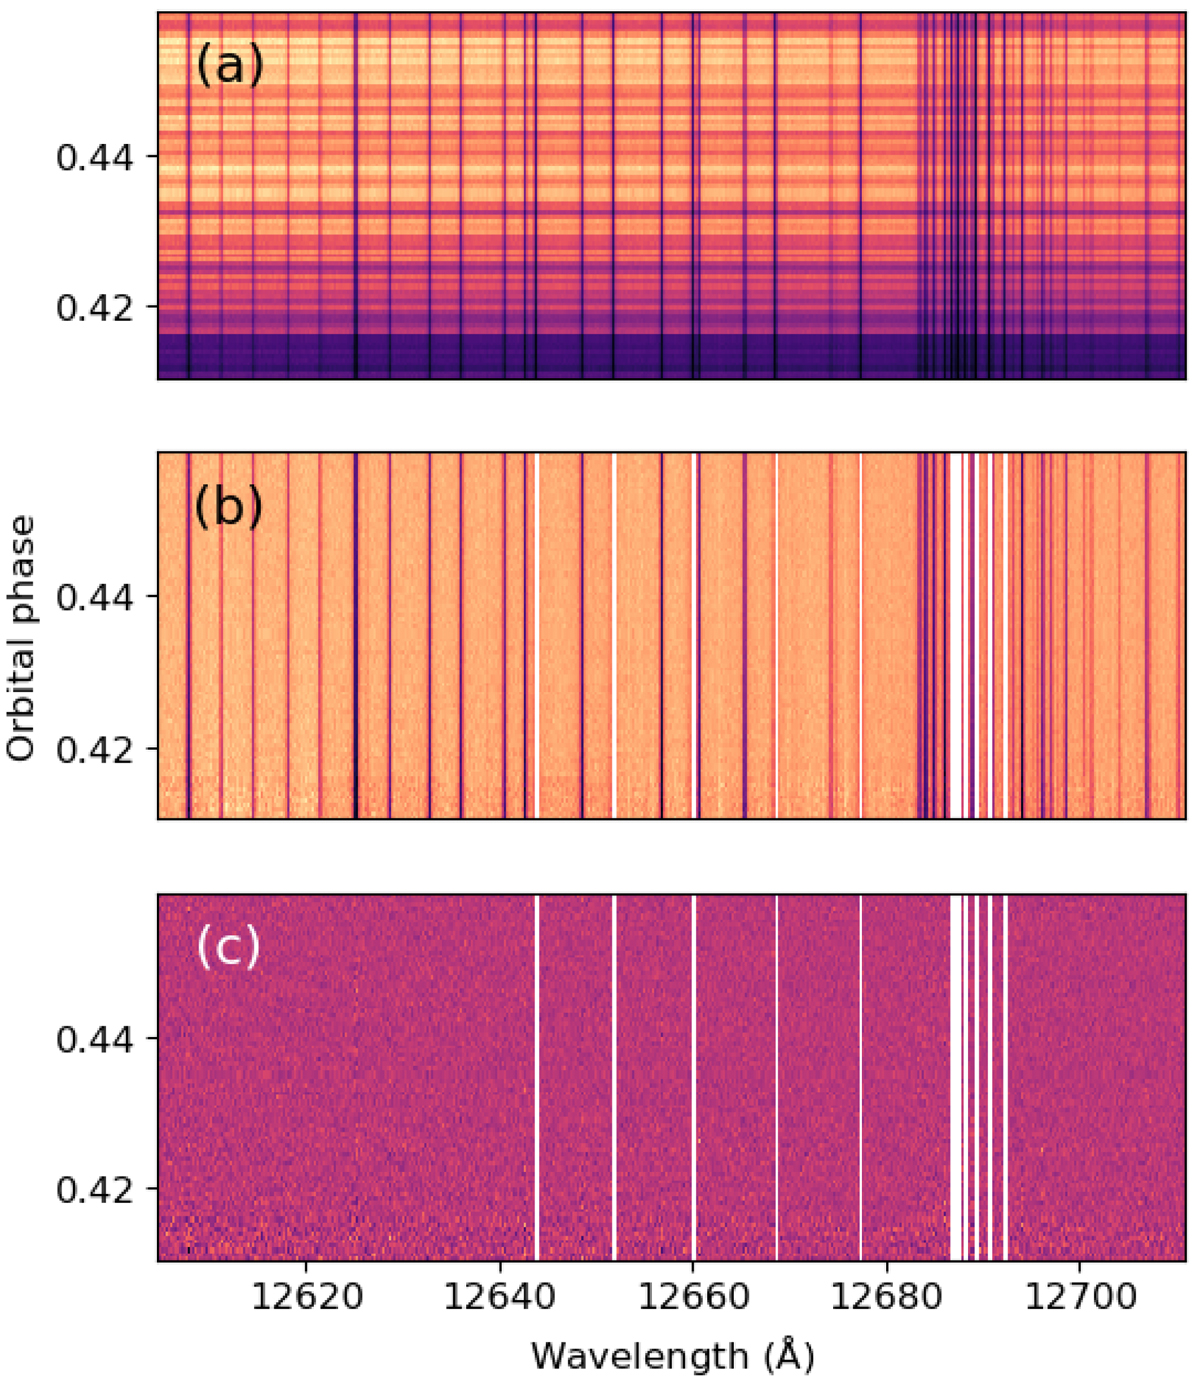
Fig. B.1.
Download original image
Example of data reduction steps for a selected CARMENES wavelength range (observation on 21 May 2020). Panel a: shows the unprocessed one-dimensional spectra. Panel b: illustrates the spectra after normalization and outlier correction; the strongest telluric lines are masked in this step. Panel c: shows the SYSREM reduced spectra after telluric and stellar line removal.
Current usage metrics show cumulative count of Article Views (full-text article views including HTML views, PDF and ePub downloads, according to the available data) and Abstracts Views on Vision4Press platform.
Data correspond to usage on the plateform after 2015. The current usage metrics is available 48-96 hours after online publication and is updated daily on week days.
Initial download of the metrics may take a while.