Free Access
Fig. D.1.
Download original image
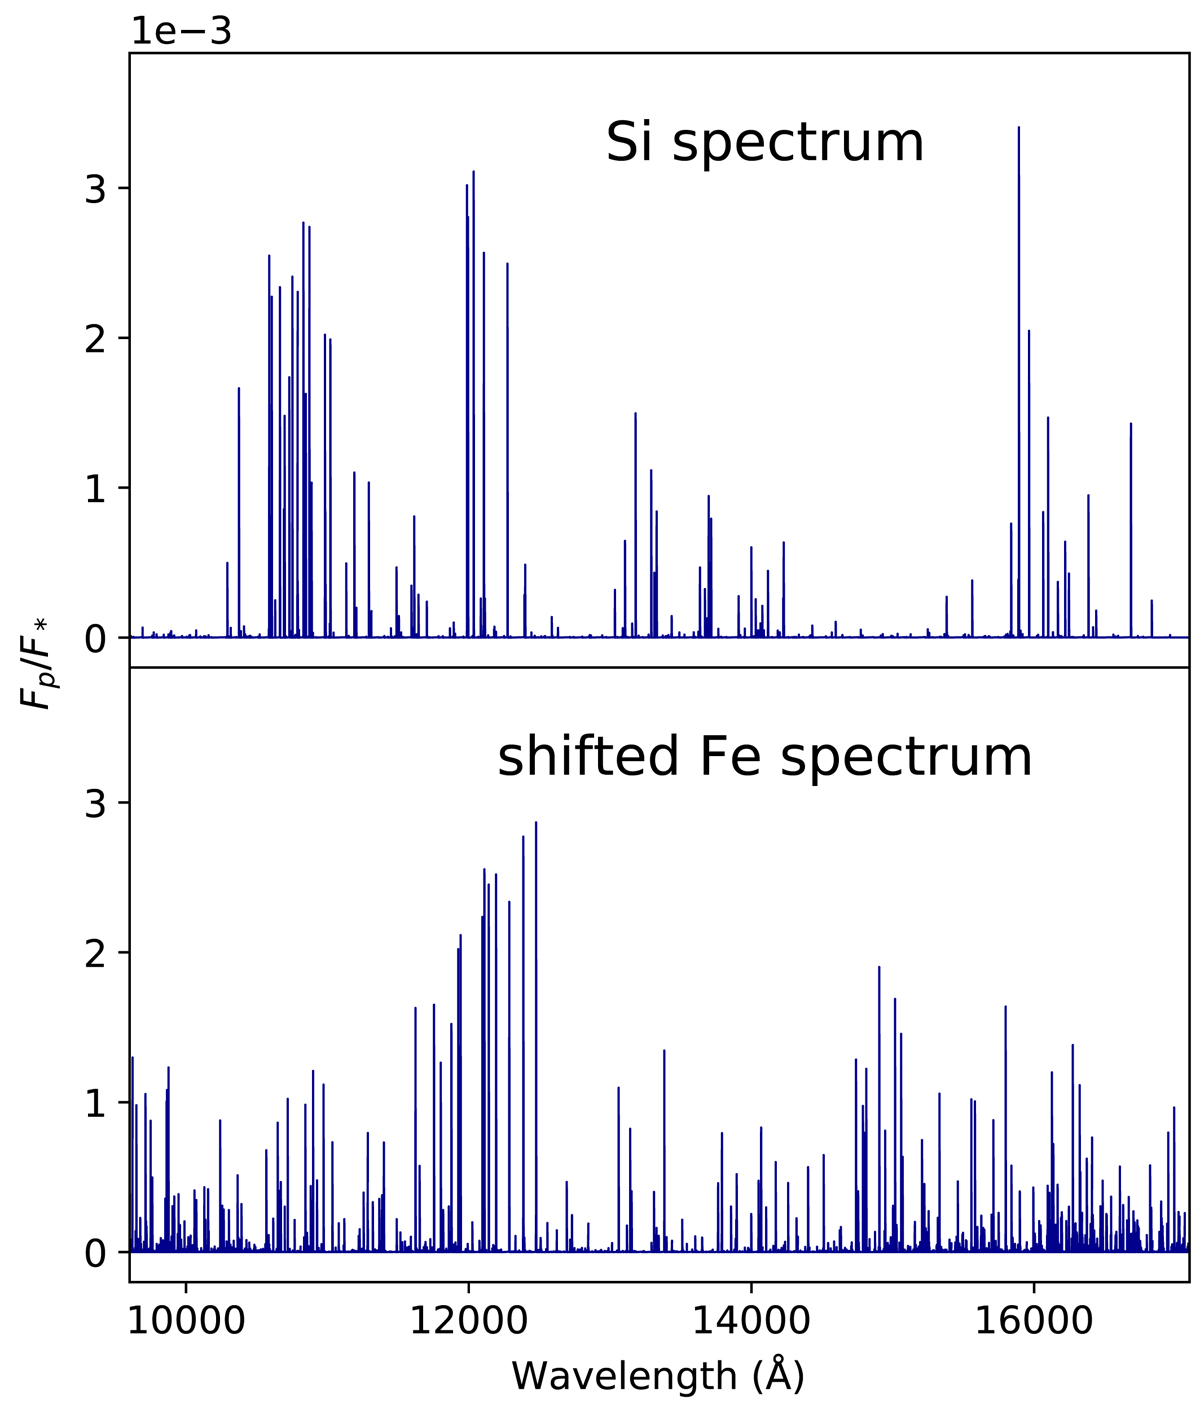
Comparison between the Si model spectrum of WASP-33b (top panel) and the wavelength-shifted Fe model (bottom panel). We note that the density and amplitude of the emission lines in the two models are similar.
Current usage metrics show cumulative count of Article Views (full-text article views including HTML views, PDF and ePub downloads, according to the available data) and Abstracts Views on Vision4Press platform.
Data correspond to usage on the plateform after 2015. The current usage metrics is available 48-96 hours after online publication and is updated daily on week days.
Initial download of the metrics may take a while.