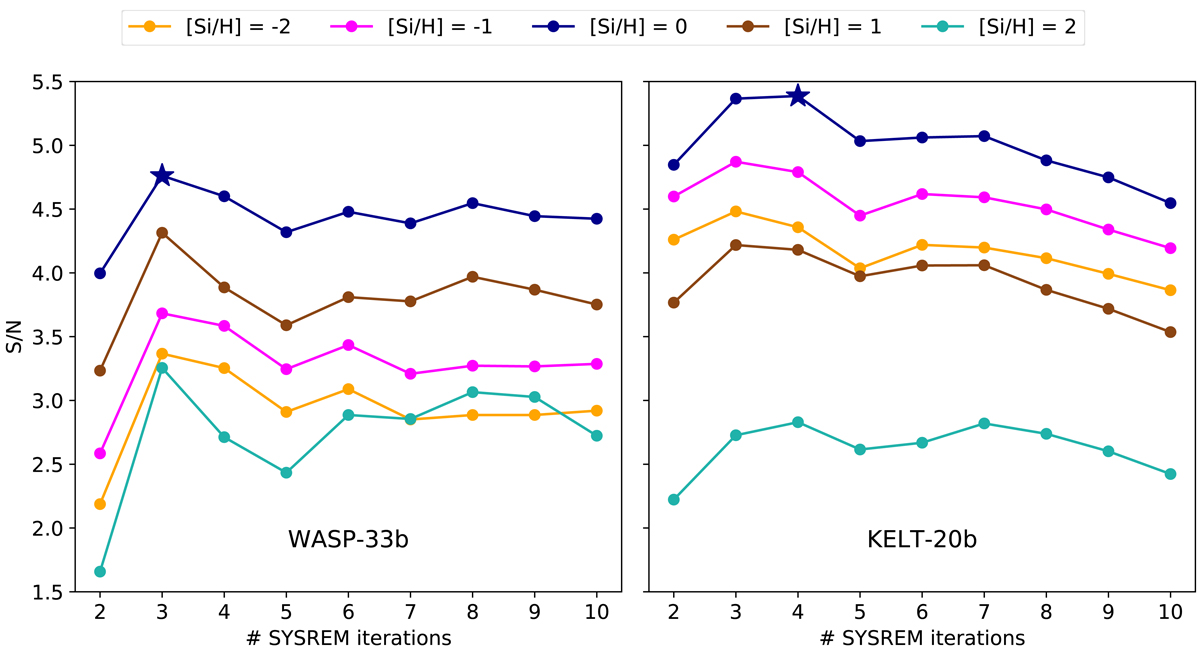
Fig. C.6.
Download original image
Evolution of the S/N detection strength (measured at the position of the strongest peak; see Sect. 4) with increasing SYSREM iteration. We show the S/Ns of WASP-33b and KELT-20b in the left and right panels, respectively. The different Si abundances are indicated by different colors. The strongest S/N peaks are found for both planets at [Si/H] = 0 and are indicated by the blue stars.
Current usage metrics show cumulative count of Article Views (full-text article views including HTML views, PDF and ePub downloads, according to the available data) and Abstracts Views on Vision4Press platform.
Data correspond to usage on the plateform after 2015. The current usage metrics is available 48-96 hours after online publication and is updated daily on week days.
Initial download of the metrics may take a while.