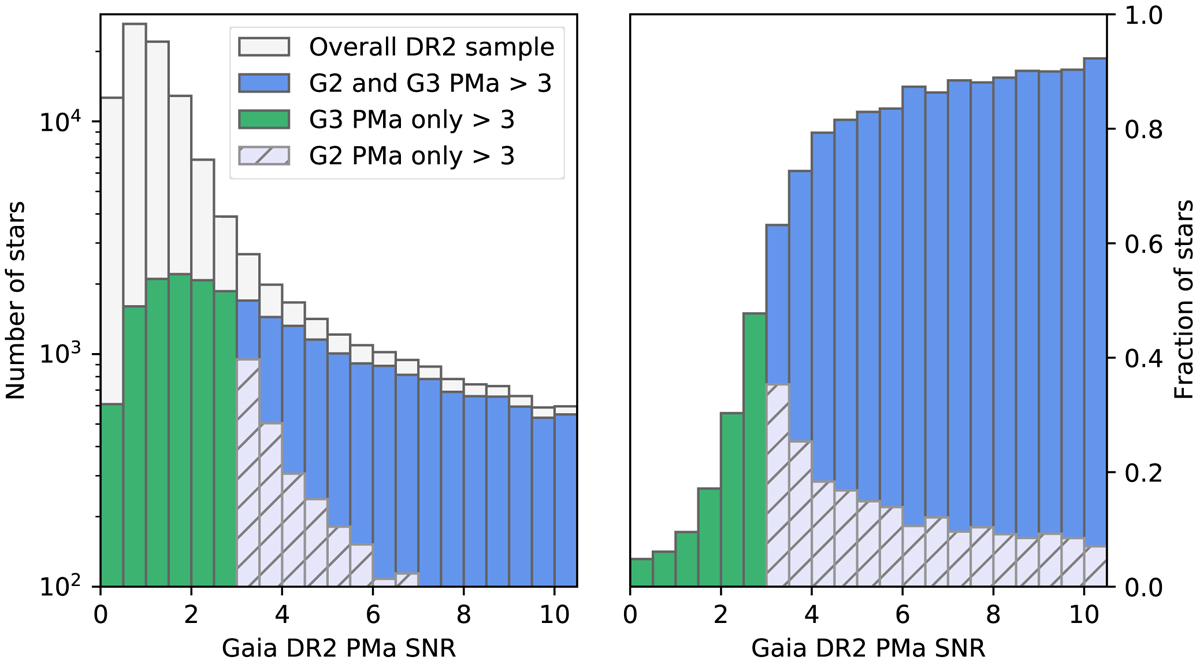
Fig. 4.
Download original image
Histogram of the S/N of the PMa signal from Gaia DR2 (light grey), the stars presenting a PMa S/N > 3 both in DR2 and EDR3 (medium blue), the stars with a PMa S/N > 3 only in DR2 (hatched light blue), and the stars with a PMa S/N > 3 only in the EDR3 (green). Right panel: corresponding fraction of the stars in the total sample per S/N bin.
Current usage metrics show cumulative count of Article Views (full-text article views including HTML views, PDF and ePub downloads, according to the available data) and Abstracts Views on Vision4Press platform.
Data correspond to usage on the plateform after 2015. The current usage metrics is available 48-96 hours after online publication and is updated daily on week days.
Initial download of the metrics may take a while.