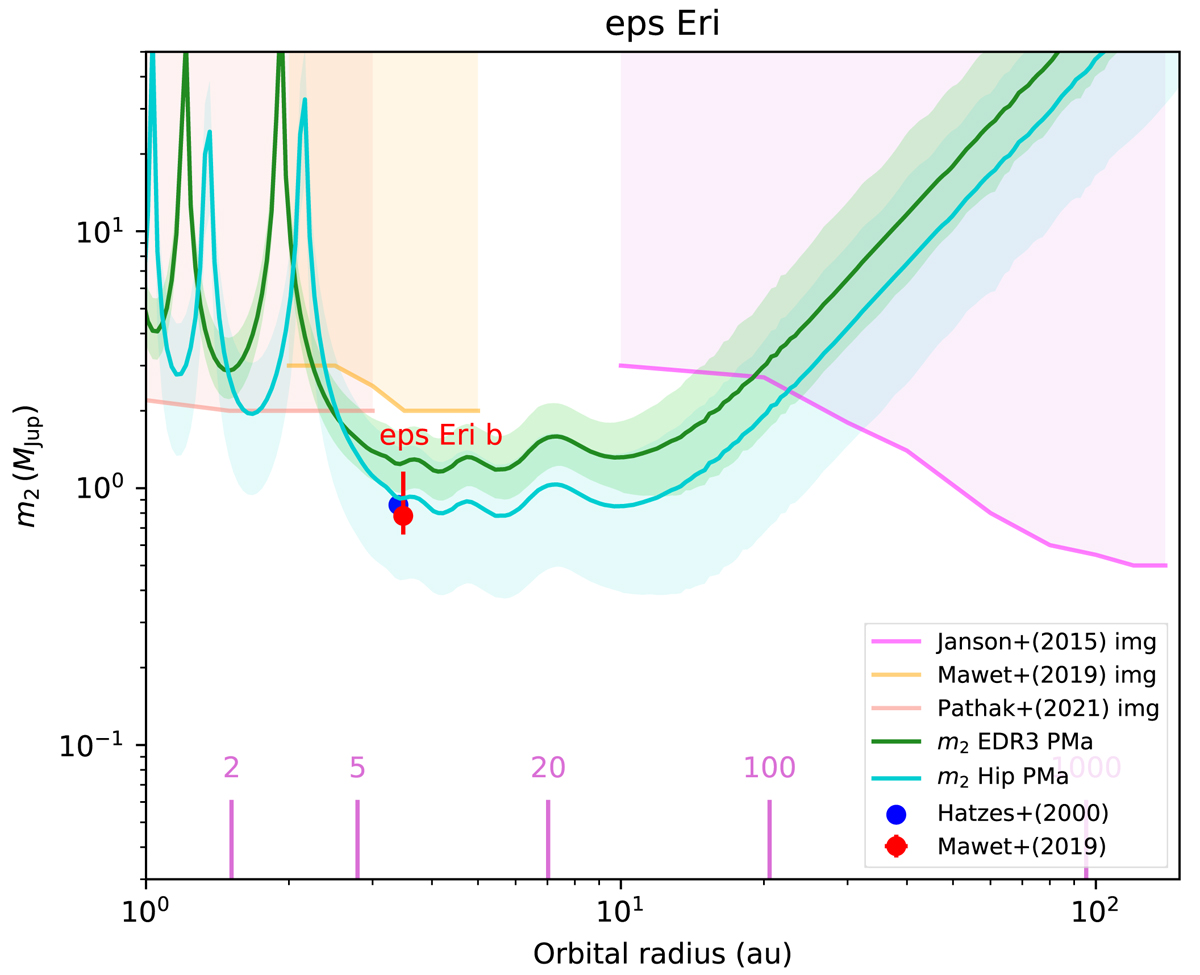
Fig. 20.
Download original image
PMa sensitivity diagram of ϵ Eri for the HIPPARCOS (cyan) and EDR3 (green) measurements. The shaded regions represent the planet properties excluded by direct imaging searches.
Current usage metrics show cumulative count of Article Views (full-text article views including HTML views, PDF and ePub downloads, according to the available data) and Abstracts Views on Vision4Press platform.
Data correspond to usage on the plateform after 2015. The current usage metrics is available 48-96 hours after online publication and is updated daily on week days.
Initial download of the metrics may take a while.