Fig. 19.
Download original image
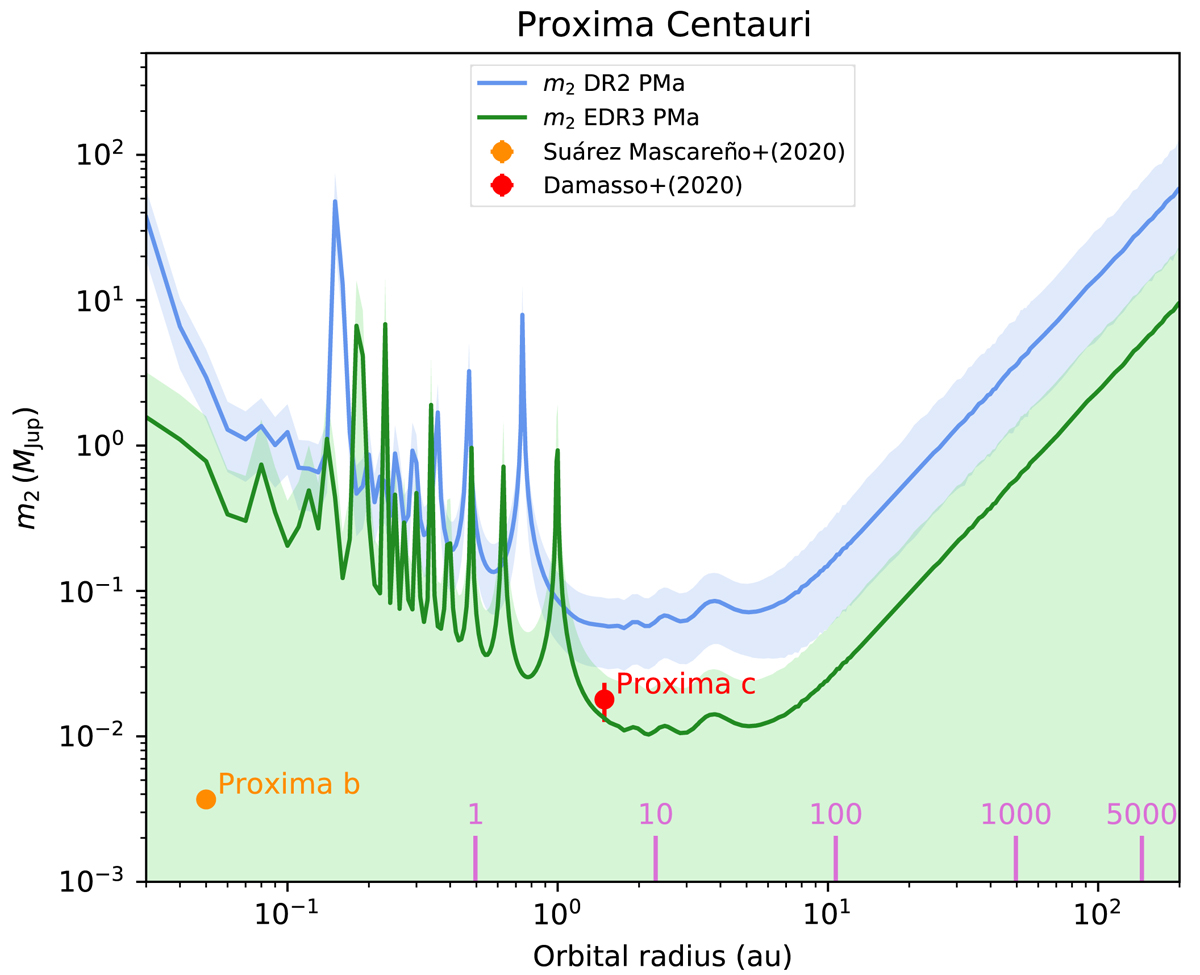
PMa sensitivity diagram of Proxima for Gaia DR2 (blue) and EDR3 (green) measurements. The minimum masses of the planets Proxima b (Suárez Mascareño et al. 2020) and c Damasso et al. (2020a) are represented with orange and red symbols, respectively.
Current usage metrics show cumulative count of Article Views (full-text article views including HTML views, PDF and ePub downloads, according to the available data) and Abstracts Views on Vision4Press platform.
Data correspond to usage on the plateform after 2015. The current usage metrics is available 48-96 hours after online publication and is updated daily on week days.
Initial download of the metrics may take a while.