Fig. 12.
Download original image
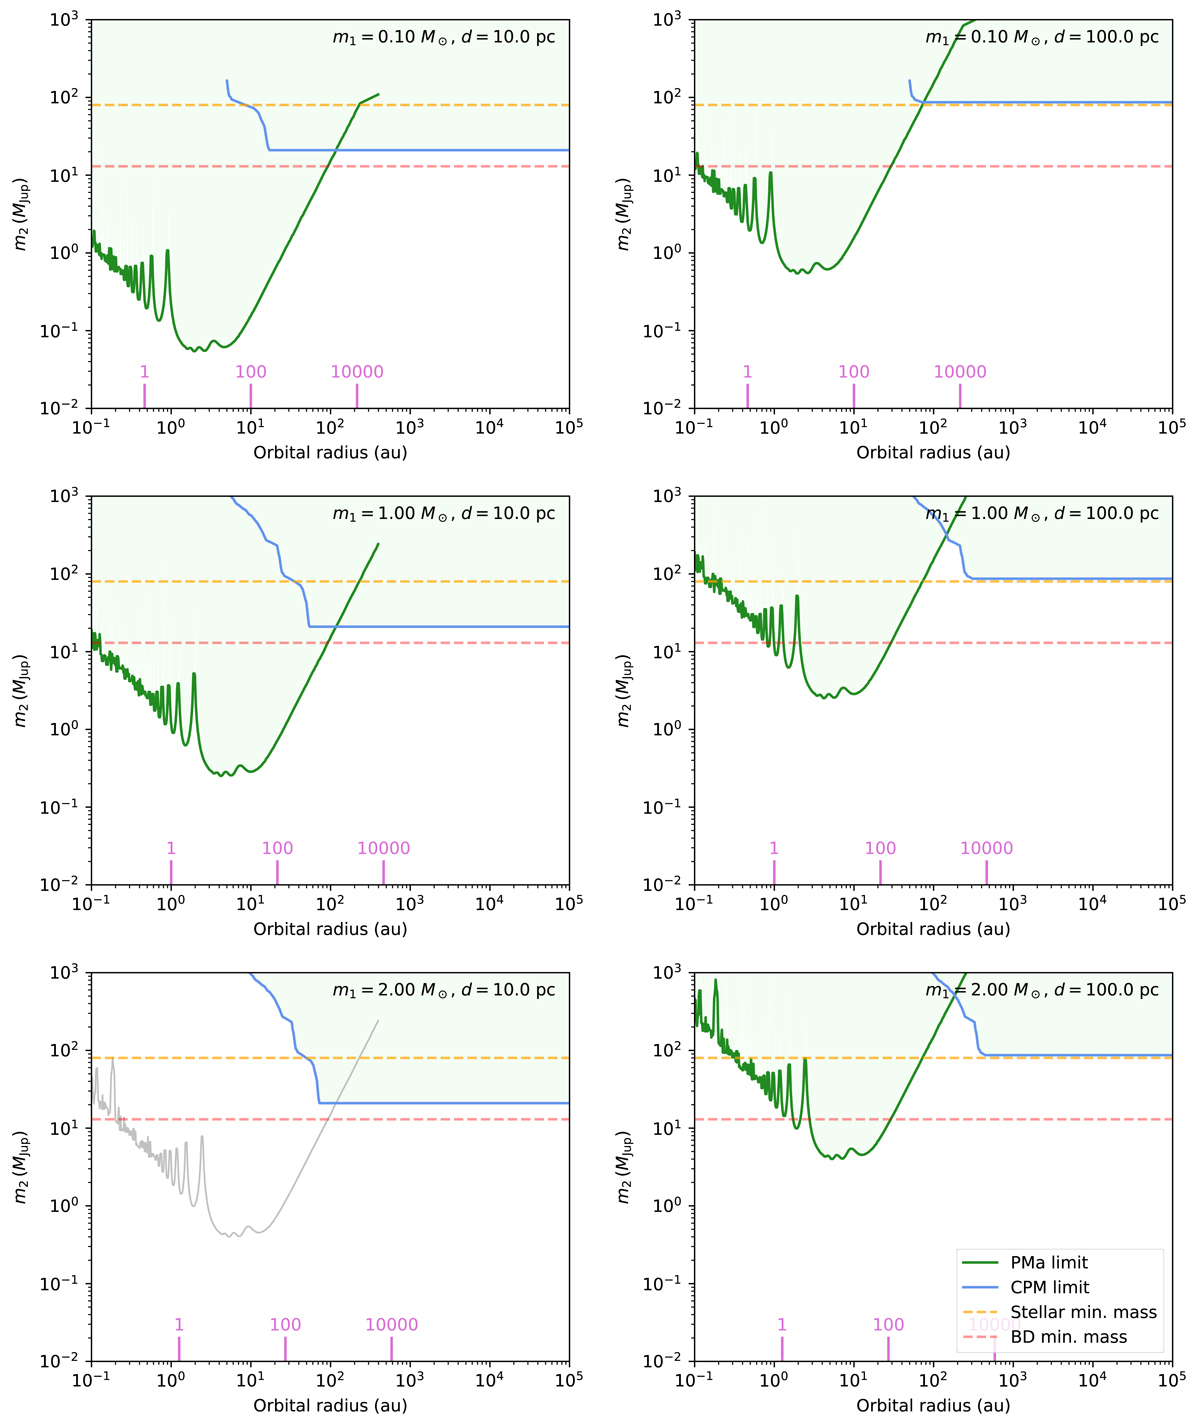
Combined sensitivity limits of the PMa and CPM detection techniques for different combinations of target mass and distance. When the target star is too bright for the application of the PMa technique (G < 3.0) the sensitivity curve is shown in grey. The substellar (m2 = 80 MJup) and planetary (m2 = 13 MJup) mass limits are shown with dashed lines.
Current usage metrics show cumulative count of Article Views (full-text article views including HTML views, PDF and ePub downloads, according to the available data) and Abstracts Views on Vision4Press platform.
Data correspond to usage on the plateform after 2015. The current usage metrics is available 48-96 hours after online publication and is updated daily on week days.
Initial download of the metrics may take a while.