Fig. 9.
Download original image
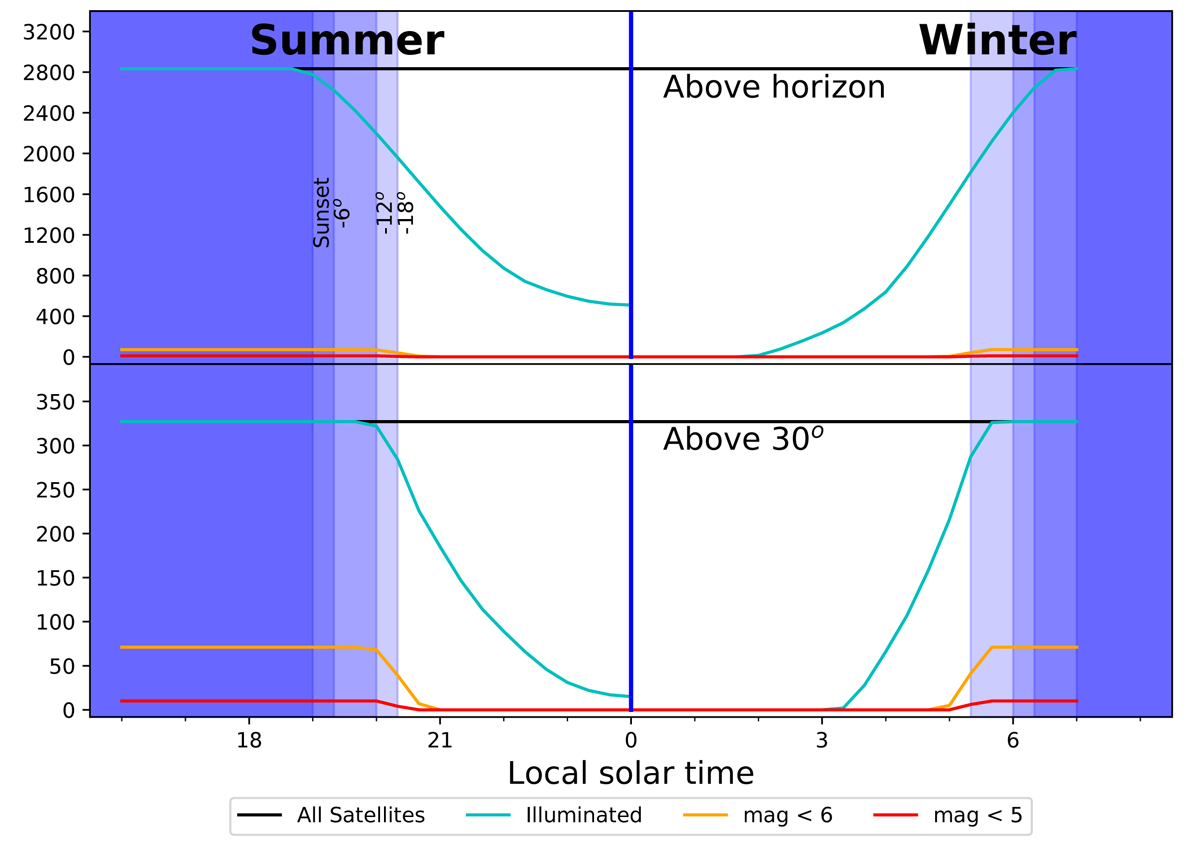
Number of illuminated satellites above the horizon (top panel) and above 30° elevation, as a function of the local solar time, for Paranal (latitude ![]() ). The figure accounts for all the satellites from Table 1. Left is for the summer solstice (
). The figure accounts for all the satellites from Table 1. Left is for the summer solstice (![]() ) and right for the winter solstice (
) and right for the winter solstice (![]() ). The twilights are indicated with blue shading. The black line marks the total number of satellites above the elevation considered, the blue line those that are illuminated and the orange and red lines those brighter than magnitude 6 and 5, respectively, using the photometric model described in Sect. 2.2. This shows that during the summer months, a few hundred satellites would remain illuminated thorough the whole night, including a few tens above 30° elevation.
). The twilights are indicated with blue shading. The black line marks the total number of satellites above the elevation considered, the blue line those that are illuminated and the orange and red lines those brighter than magnitude 6 and 5, respectively, using the photometric model described in Sect. 2.2. This shows that during the summer months, a few hundred satellites would remain illuminated thorough the whole night, including a few tens above 30° elevation.
Current usage metrics show cumulative count of Article Views (full-text article views including HTML views, PDF and ePub downloads, according to the available data) and Abstracts Views on Vision4Press platform.
Data correspond to usage on the plateform after 2015. The current usage metrics is available 48-96 hours after online publication and is updated daily on week days.
Initial download of the metrics may take a while.