Fig. 7.
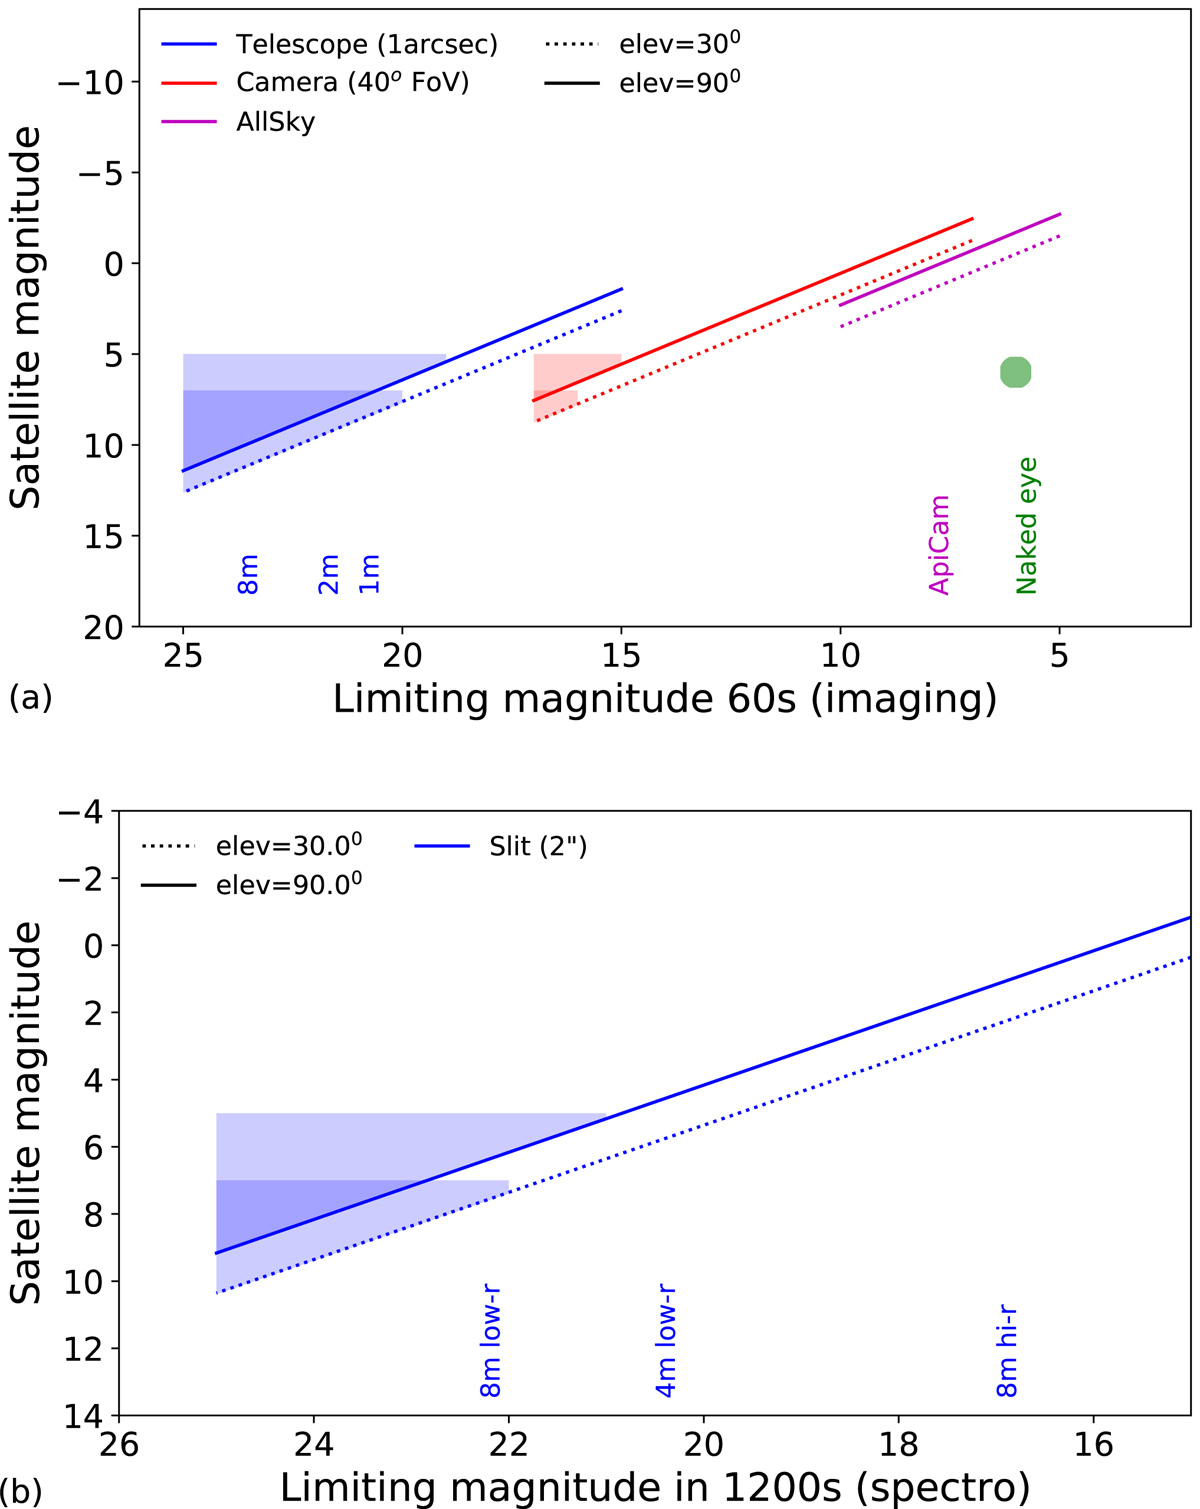
Download original image
Detection limit for the satellite apparent magnitude (coloured lines) as a function of the limiting magnitude of the instrument (both are at the same S/N). Panel a: results for 60 s exposures with an imager, while (b): prediction for 1200 s exposures with a spectrograph. The trailing of a satellite below the coloured line will make its effective magnitude too faint for detection. The shaded areas highlight the range where constellation satellites are likely to be detected. Two elevations (zenith and airmass 2) are considered, with the corresponding typical satellite visual magnitudes and angular velocities.
Current usage metrics show cumulative count of Article Views (full-text article views including HTML views, PDF and ePub downloads, according to the available data) and Abstracts Views on Vision4Press platform.
Data correspond to usage on the plateform after 2015. The current usage metrics is available 48-96 hours after online publication and is updated daily on week days.
Initial download of the metrics may take a while.