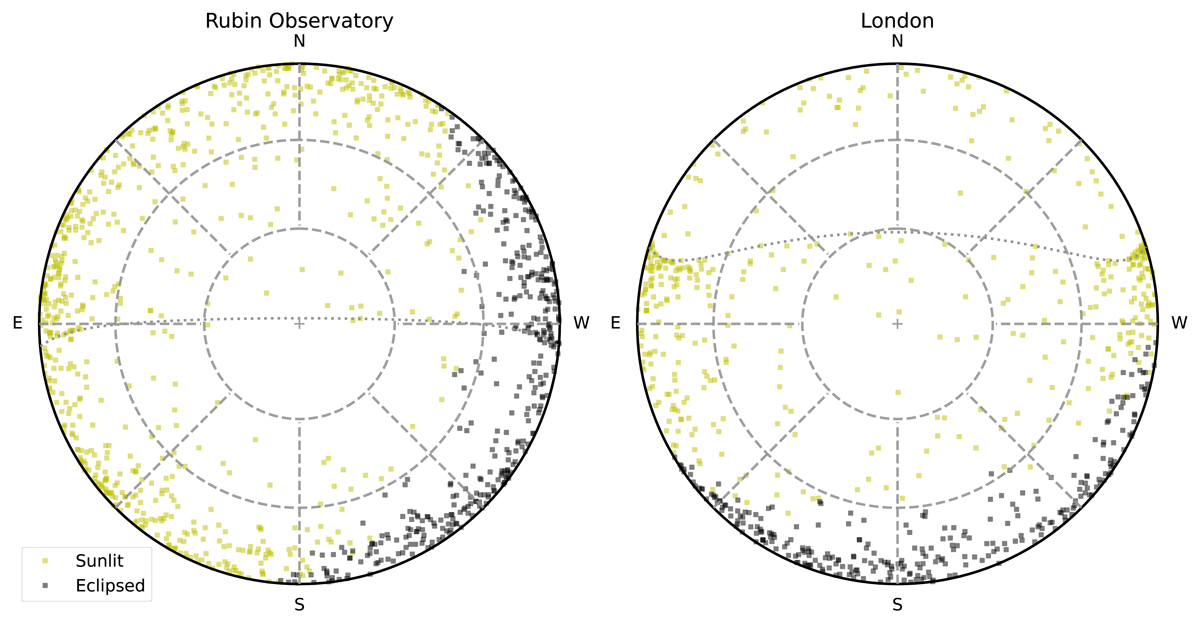
Fig. 2.
Download original image
Discrete realisation of the Starlink Generation 2 constellation from Fig. 1. The satellites are plotted on all sky maps representing the celestial sphere above Vera Rubin Observatory (left) and London (right). Satellites are shown as sunlit (yellow) or eclipsed by the Earth (black). The number of satellites increases towards the horizon because, for a given solid angle, looking at lower elevations from the horizon the distance to the shell surface increases and, hence, the field of view contains larger portions of the orbital shells. Due to the orbital inclination and orbital altitude of the orbital shells, over-densities of satellites are also present in these maps. The map for London shows this very clearly for the two orbital shells with i = 53° and h = 345 km (7178 satellites) and 499 km (4000 satellites), where more satellites are present south from the dotted line. The dotted line in the all sky map for Vera Rubin Observatory is for the orbital shell with i = 30°, h = 328 km, with a larger number of satellites north from that line.
Current usage metrics show cumulative count of Article Views (full-text article views including HTML views, PDF and ePub downloads, according to the available data) and Abstracts Views on Vision4Press platform.
Data correspond to usage on the plateform after 2015. The current usage metrics is available 48-96 hours after online publication and is updated daily on week days.
Initial download of the metrics may take a while.