Fig. 16.
Download original image
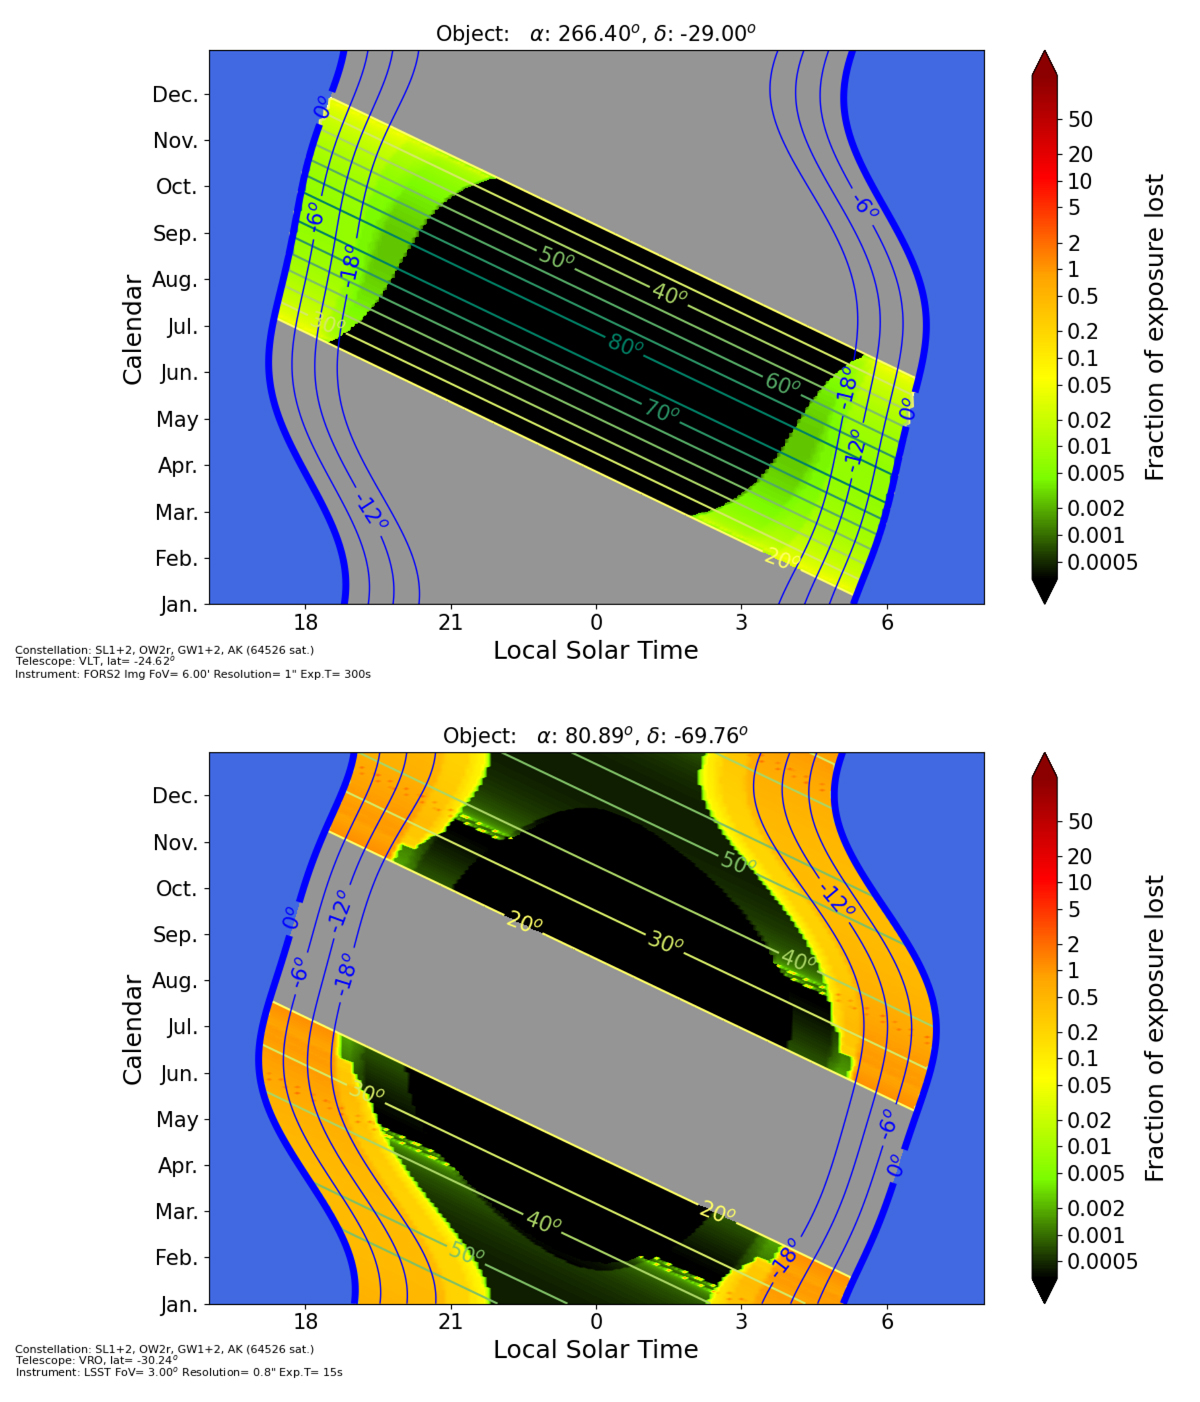
Two examples of calendars showing the visibility of an object from an observatory. Top: galactic Centre from the VLT. Bottom: large Magellanic Cloud from VRO. The fraction of observing time lost due to satellites is indicated by the colour scale (1 indicating that all exposures are damaged), for 300 s exposures with FORS2 and 15 s on the LSST camera, respectively. The satellites are the 60+ thousand from Table 1. The blue shading marks daytime and the blue contours indicate the twilights. The elevation of the object is indicated by the greenish contour lines and the grey shading indicates the times when the object is below 20° elevation.
Current usage metrics show cumulative count of Article Views (full-text article views including HTML views, PDF and ePub downloads, according to the available data) and Abstracts Views on Vision4Press platform.
Data correspond to usage on the plateform after 2015. The current usage metrics is available 48-96 hours after online publication and is updated daily on week days.
Initial download of the metrics may take a while.