Fig. 12.
Download original image
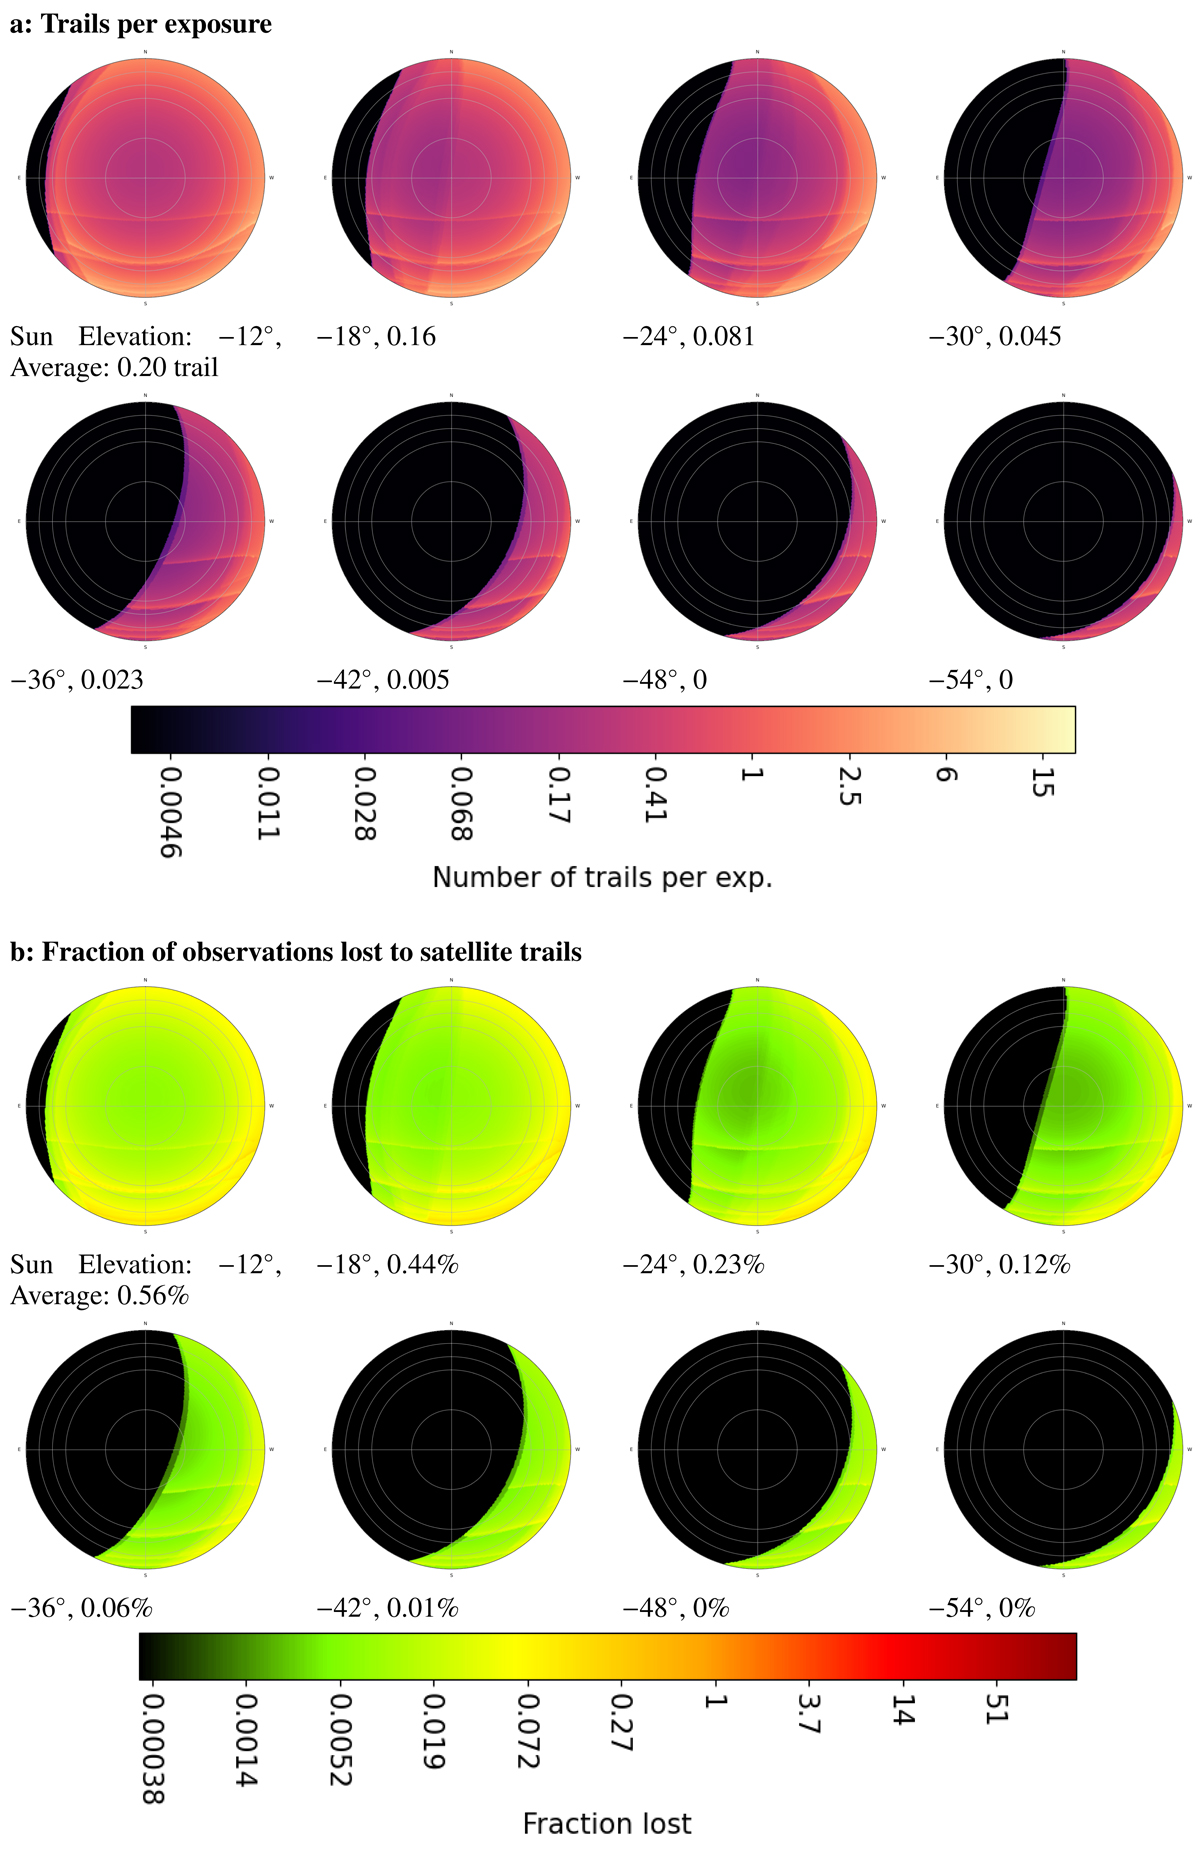
Sky maps of the number of detectable satellite trails (a) and effect on the observations (b), for all the satellites from Table 1 on a FORS2 image (6′ field of view, 5 min exposure time) on Paranal (![]() latitude) at equinox. The circles indicate elevations 0°, 10°, 30°, and 60°. The legend of each plot gives the Sun elevation and the average number of trails (a) and the losses they cause (b) for observations above 30° elevation All satellites are brighter than the detection limit and none is bright enough to cause heavy saturation.
latitude) at equinox. The circles indicate elevations 0°, 10°, 30°, and 60°. The legend of each plot gives the Sun elevation and the average number of trails (a) and the losses they cause (b) for observations above 30° elevation All satellites are brighter than the detection limit and none is bright enough to cause heavy saturation.
Current usage metrics show cumulative count of Article Views (full-text article views including HTML views, PDF and ePub downloads, according to the available data) and Abstracts Views on Vision4Press platform.
Data correspond to usage on the plateform after 2015. The current usage metrics is available 48-96 hours after online publication and is updated daily on week days.
Initial download of the metrics may take a while.