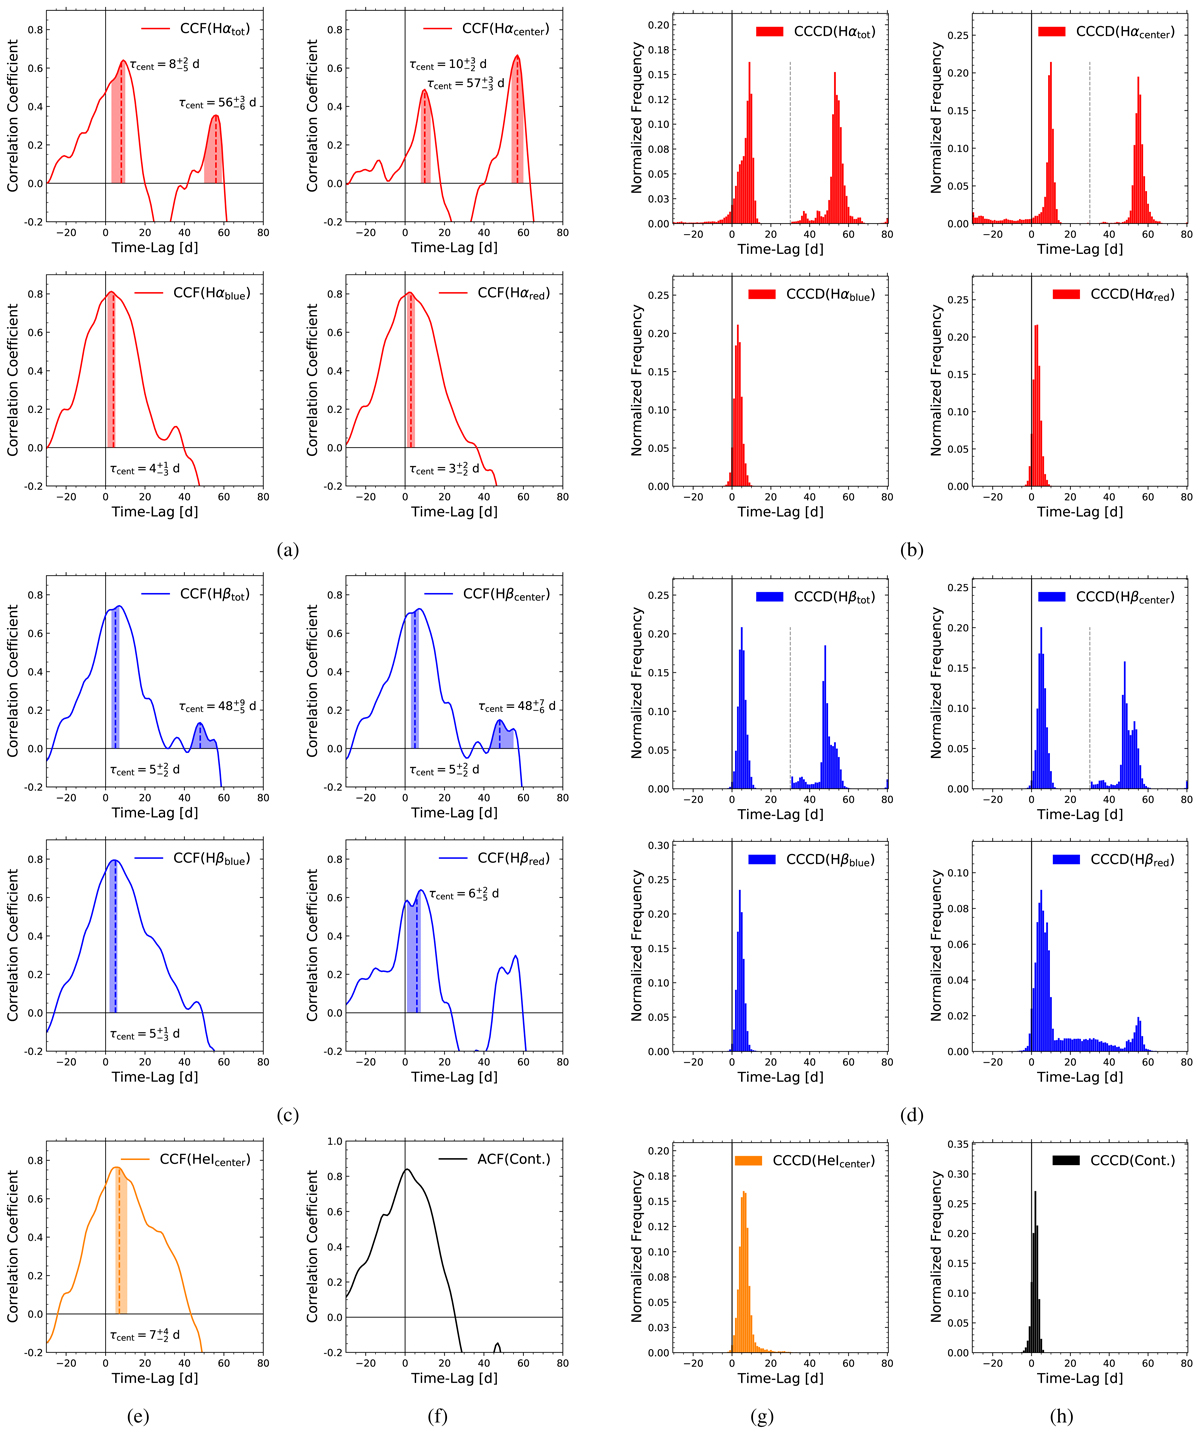
Fig. 9.
Download original image
Left panel: CCFs of the integrated Hα(a) and Hβ(c) line, of their segments (center, blue, red), and of the central He I line (e) with respect to the combined continuum at 5180 Å (rest frame). The time lag, τcent, is denoted by a dashed line, with the shaded area corresponding to a ±1σ interval. The CCF of the spectroscopic continuum light curve with respect to the combined (photometric plus spectroscopic) continuum reference light curve is shown in (f). Right panel: CCCDs of the integrated Hα(b) and Hβ(d) line, of their segments (center, blue, red), and of the central He I line (g) with respect to the combined continuum at 5180 Å (rest frame). The boundary between CCCDs of individual peaks is denoted by a dashed gray line. The CCCD of the spectroscopic continuum light curve with respect to the combined continuum reference light curve is shown in (h).
Current usage metrics show cumulative count of Article Views (full-text article views including HTML views, PDF and ePub downloads, according to the available data) and Abstracts Views on Vision4Press platform.
Data correspond to usage on the plateform after 2015. The current usage metrics is available 48-96 hours after online publication and is updated daily on week days.
Initial download of the metrics may take a while.