Free Access
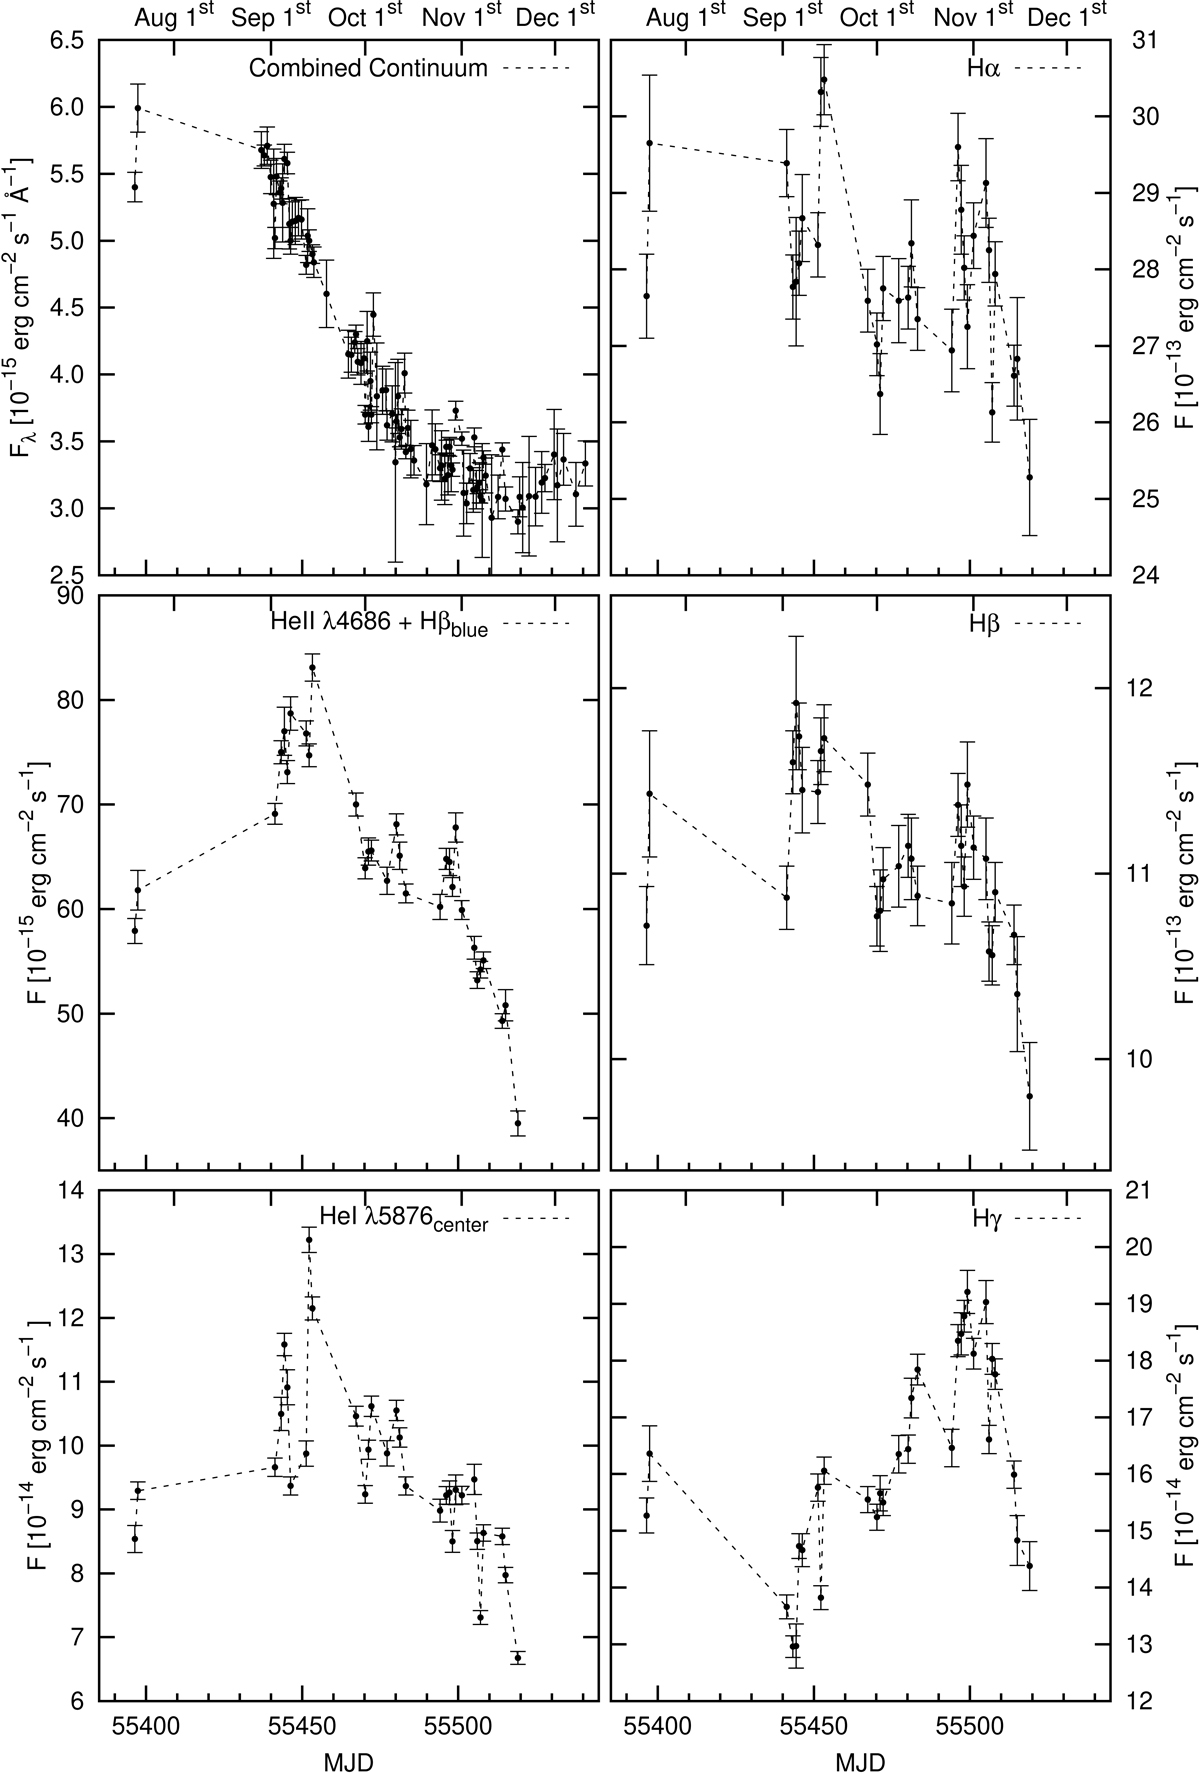
Fig. 6.
Download original image
Light curves of the combined continuum flux densities at 5420 Å (observed frame; in units of 10−15 erg cm−2 s−1 Å−1) as well as of the integrated emission-line fluxes of Hα, Hβ, Hγ, He IIλ4686 + Hβblue, and He Iλ5876 for our HET variability campaign from 2010 July 19 to November 19.
Current usage metrics show cumulative count of Article Views (full-text article views including HTML views, PDF and ePub downloads, according to the available data) and Abstracts Views on Vision4Press platform.
Data correspond to usage on the plateform after 2015. The current usage metrics is available 48-96 hours after online publication and is updated daily on week days.
Initial download of the metrics may take a while.