Fig. 10.
Download original image
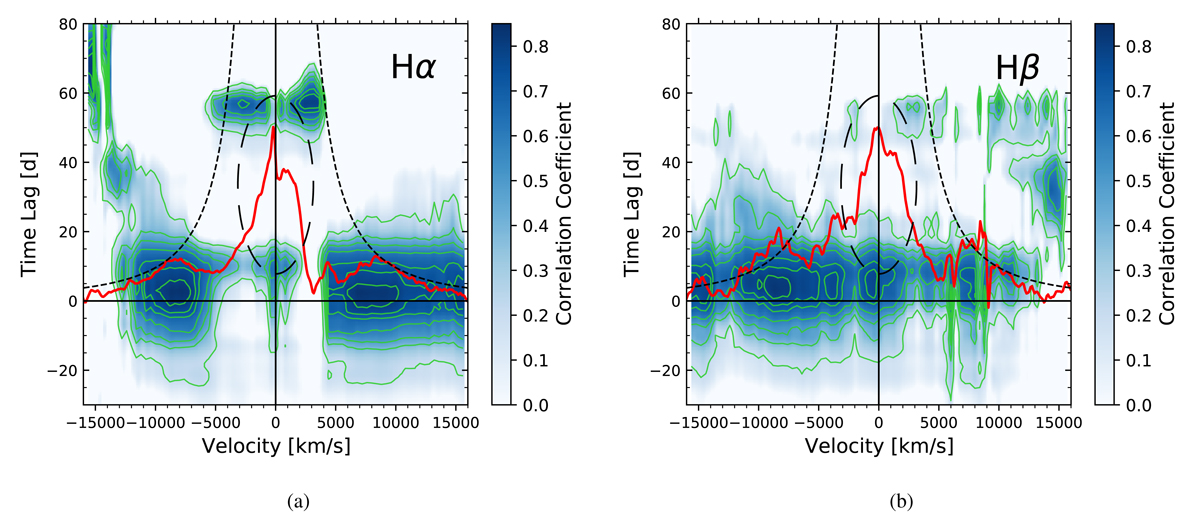
Velocity-resolved CCFs(τ, v) showing the correlation coefficient of the Hα(a) and Hβ(b) line segment light curves (Δv ∼ 400 km s−1) with respect to the combined continuum light curve as a function of velocity and time delay (blue scale). Contours of the correlation coefficients are plotted at levels 0.2, 0.4, 0.5, 0.6, 0.7, 0.75, 0.8, and 0.825 (green lines). In each plot, the rms profile of the emission line is shown in red. The dashed curve shows the escape velocities for a Keplerian disk inclined by ∼50° with a central mass of 1.1 × 10⁸ M⊙. The dashed ellipse corresponds to a circular Keplerian orbit at R/c = 33.5 d inclined by ∼50° to the line of sight mapped onto the velocity-delay plane. The line center (v = 0 km s−1) and the time delay of τ = 0 days are indicated by a vertical and a horizontal black line, respectively. The delays computed for the red wing of Hβ are disturbed by the [O III] λ 4959, 5007 lines, which results in higher-delay residuals not confined within the viral envelope.
Current usage metrics show cumulative count of Article Views (full-text article views including HTML views, PDF and ePub downloads, according to the available data) and Abstracts Views on Vision4Press platform.
Data correspond to usage on the plateform after 2015. The current usage metrics is available 48-96 hours after online publication and is updated daily on week days.
Initial download of the metrics may take a while.