Free Access
Fig. 6
Download original image
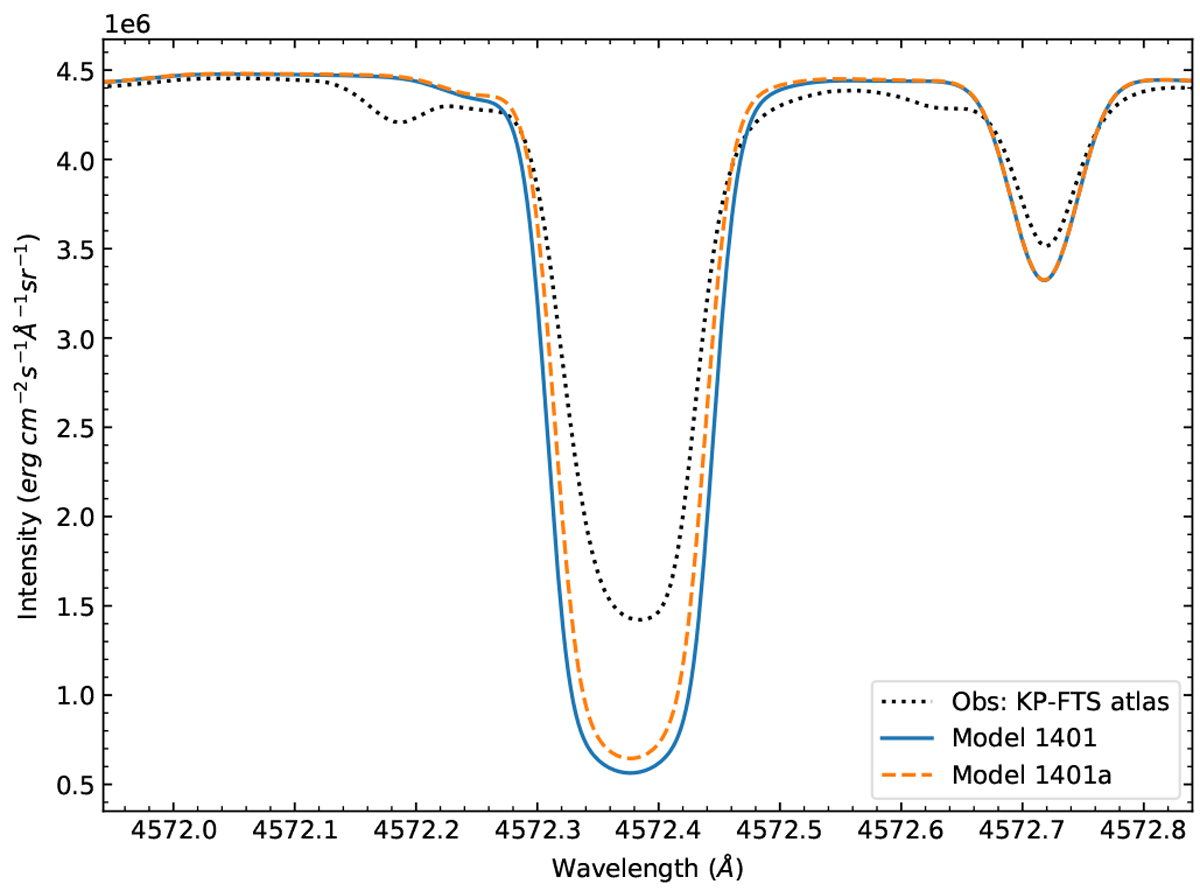
Models 1401 (blue line) and 1401a (orange dashed line) compared to Kitt Peak Solar Atlas (KP-FTS) (Hase et al. 2010)intensity observations (black dotted line). Transition 4572.4 Å shows a small improvement due to an update to the oscillator strength parameter, whose value decreased by 41%.
Current usage metrics show cumulative count of Article Views (full-text article views including HTML views, PDF and ePub downloads, according to the available data) and Abstracts Views on Vision4Press platform.
Data correspond to usage on the plateform after 2015. The current usage metrics is available 48-96 hours after online publication and is updated daily on week days.
Initial download of the metrics may take a while.