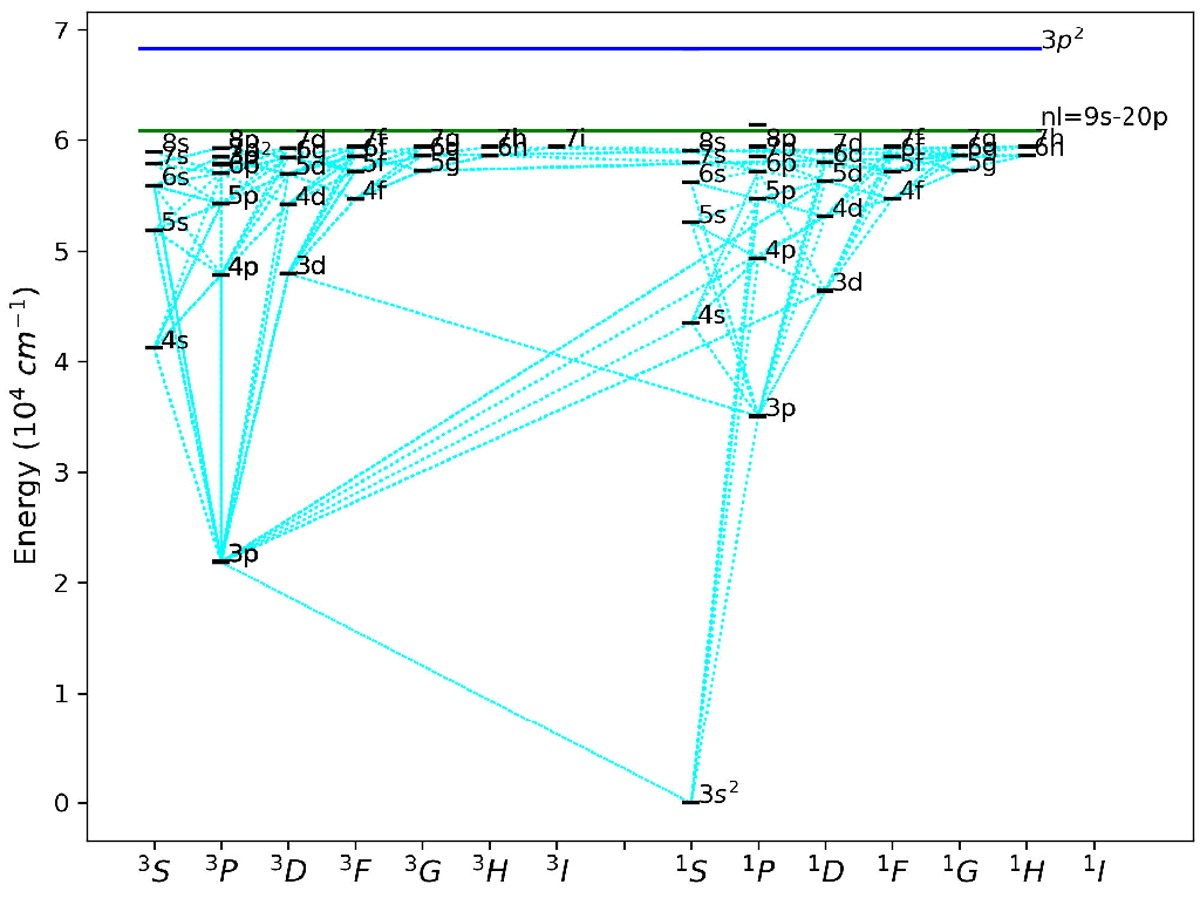
Fig. 4
Download original image
Mg I Grotrian diagram for the structure of 85-level models. Fine structure is included up to level 7i 1I (level 54, 59 430.517 cm−1) (not distinguishable in the figure). The first 54 energy levels are fully represented. Superlevels (between nl = 9s and 20p) are shown with their average energy as a solid green line, very close to the continuum (which occurs at 61 671.05 cm−1). Level 3p2 (68 275 cm−1) is represented as a solid blue line. In cyan dashed lines, the 210 transitions included in the spectrum are shown.
Current usage metrics show cumulative count of Article Views (full-text article views including HTML views, PDF and ePub downloads, according to the available data) and Abstracts Views on Vision4Press platform.
Data correspond to usage on the plateform after 2015. The current usage metrics is available 48-96 hours after online publication and is updated daily on week days.
Initial download of the metrics may take a while.