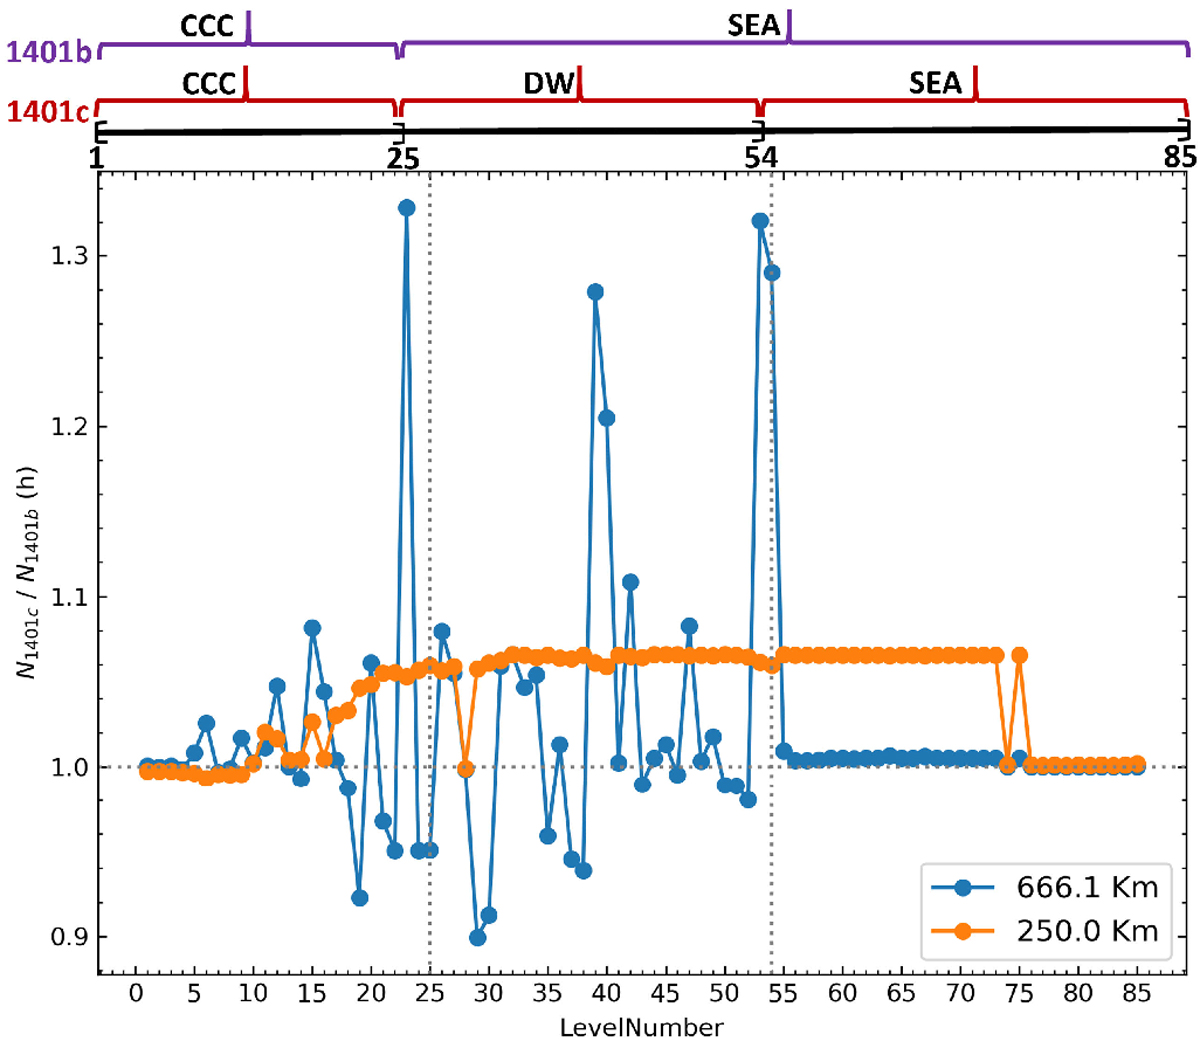
Fig. 17
Download original image
Model population ratio as a function of the energy level at 250 km (orange connected dots) and 666.1 km (blue connected dots) in the atmosphere. In the top of the figure, the ϒij data used in each model are marked. The upper level determine the ϒij data used. For example, for transition 24–38 (71 097 Å), the SEA&VRM data were used in model 1401b (in purple) and DW data were used in model 1401c (in red).
Current usage metrics show cumulative count of Article Views (full-text article views including HTML views, PDF and ePub downloads, according to the available data) and Abstracts Views on Vision4Press platform.
Data correspond to usage on the plateform after 2015. The current usage metrics is available 48-96 hours after online publication and is updated daily on week days.
Initial download of the metrics may take a while.