Fig. 15
Download original image
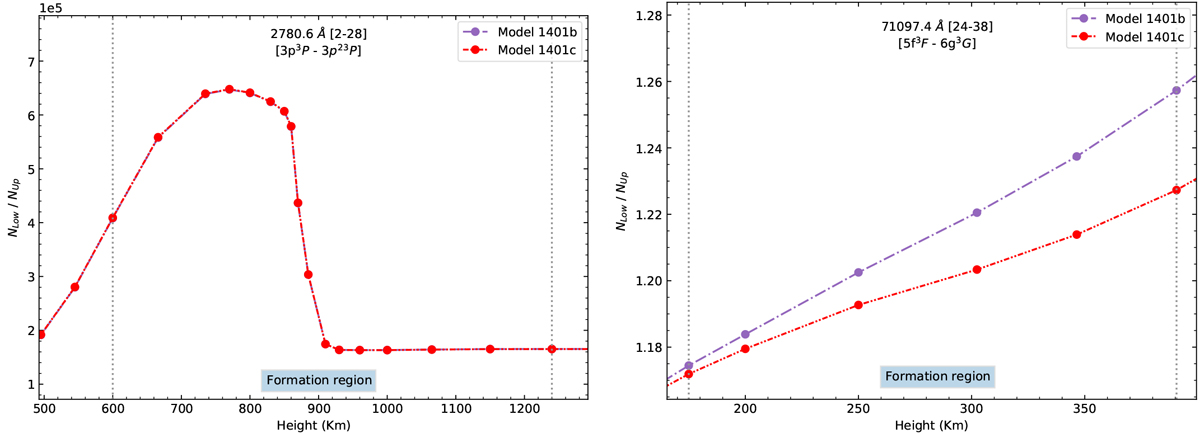
LevelPopulation ratio (Nlow∕Nup) at formation heights for transitions 2780.6 Å (left) and 71 097 Å (right), following the examples in Figs. 14a and b and Figs. 14c and d, respectively. Left panel: the ratios are identical for models 1401b (purple dashed-dotted line) and 1401c (red dashed-double-dotted line), producing the same line (shown in Fig. 9). Right panel: as in almost every IR transition, level population ratios are higher in model 1401b, producing deeper spectral lines (the line for this example is shown in Fig. 11d).
Current usage metrics show cumulative count of Article Views (full-text article views including HTML views, PDF and ePub downloads, according to the available data) and Abstracts Views on Vision4Press platform.
Data correspond to usage on the plateform after 2015. The current usage metrics is available 48-96 hours after online publication and is updated daily on week days.
Initial download of the metrics may take a while.