Fig. 11
Download original image
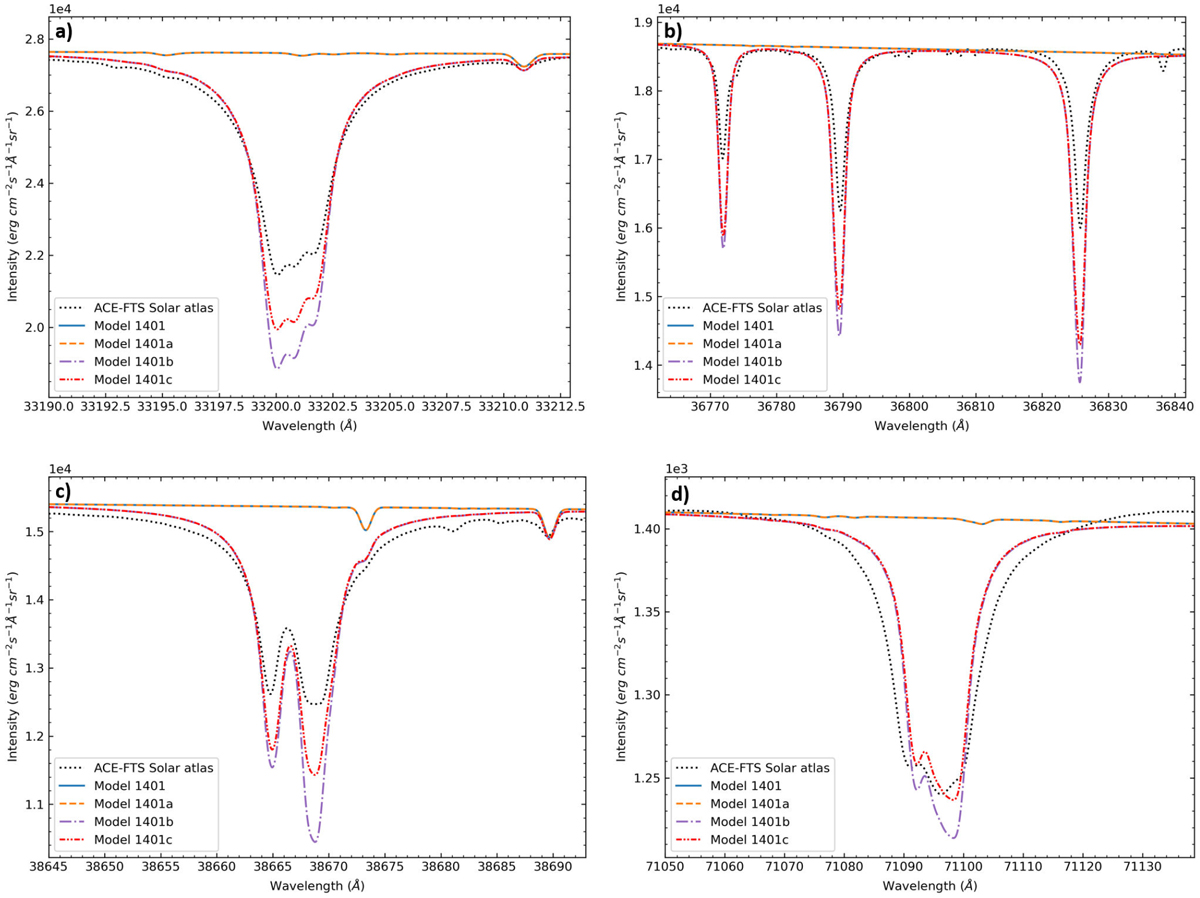
IR computed spectral lines vs. ACE-FTS Solar Atlas observations (black dottedline). The 26-level models 1401 (blue line) and 1401a (orange dashed line) follow the continuum, and 85-level models 1401b (purple dashed-dotted line) and 1401c (red dashed-double-dotted line) fit the observations. Term-term transitions: (a) 33 200.6 Å, (b) 36 807.6 Å, (c) 38 664.9, 38 669.1, and 38 670.4 Å, and (d) 71 092.0 and 71 097.4 Å. See Table 3 for line parameters. Although synthetic lines are deeper than observations, Mg I model 1401c with the new DW ϒij data produces a better match throughout part of the IR range.
Current usage metrics show cumulative count of Article Views (full-text article views including HTML views, PDF and ePub downloads, according to the available data) and Abstracts Views on Vision4Press platform.
Data correspond to usage on the plateform after 2015. The current usage metrics is available 48-96 hours after online publication and is updated daily on week days.
Initial download of the metrics may take a while.