Fig. 10
Download original image
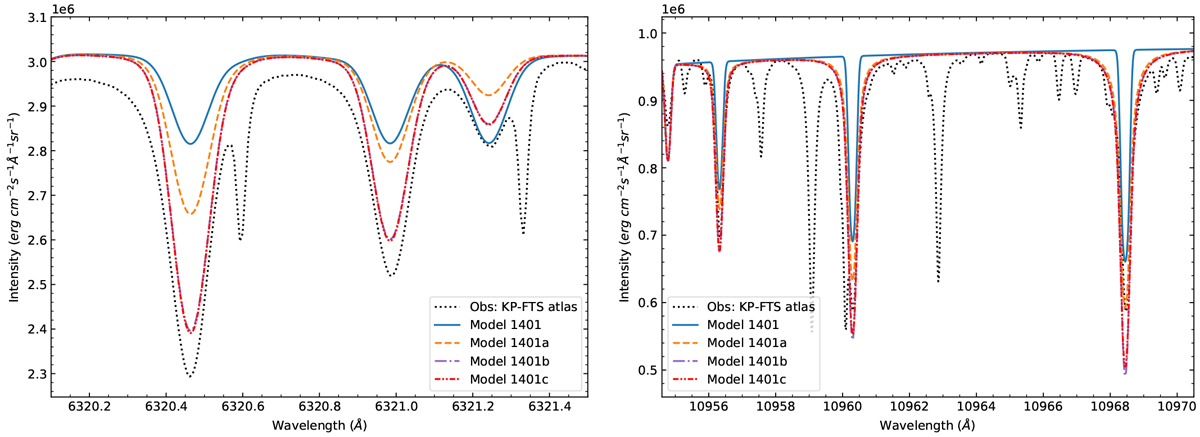
VIS and NIR spectral lines. Models 1401 (blue line), 1401a (orange dashed line), 1401b (purple dashed-dotted line), and 1401c (red dashed-double-dotted line) vs. observations (black dotted line). Left. Visible range: transitions 6320.72 Å compared to Kitt Peak Solar Atlas (KP-FTS) (Hase et al. 2010) intensity observations. Changes due to a higher number of levels (models 1401b and 1401c) are clearly visible. Right. NIR range: transitions 10 964.38 Å show improvements due to changes in the broadening data (not included in model 1401) and the increment in the number of energy levels (models 1401b and 1401c).
Current usage metrics show cumulative count of Article Views (full-text article views including HTML views, PDF and ePub downloads, according to the available data) and Abstracts Views on Vision4Press platform.
Data correspond to usage on the plateform after 2015. The current usage metrics is available 48-96 hours after online publication and is updated daily on week days.
Initial download of the metrics may take a while.