Fig. 5
Download original image
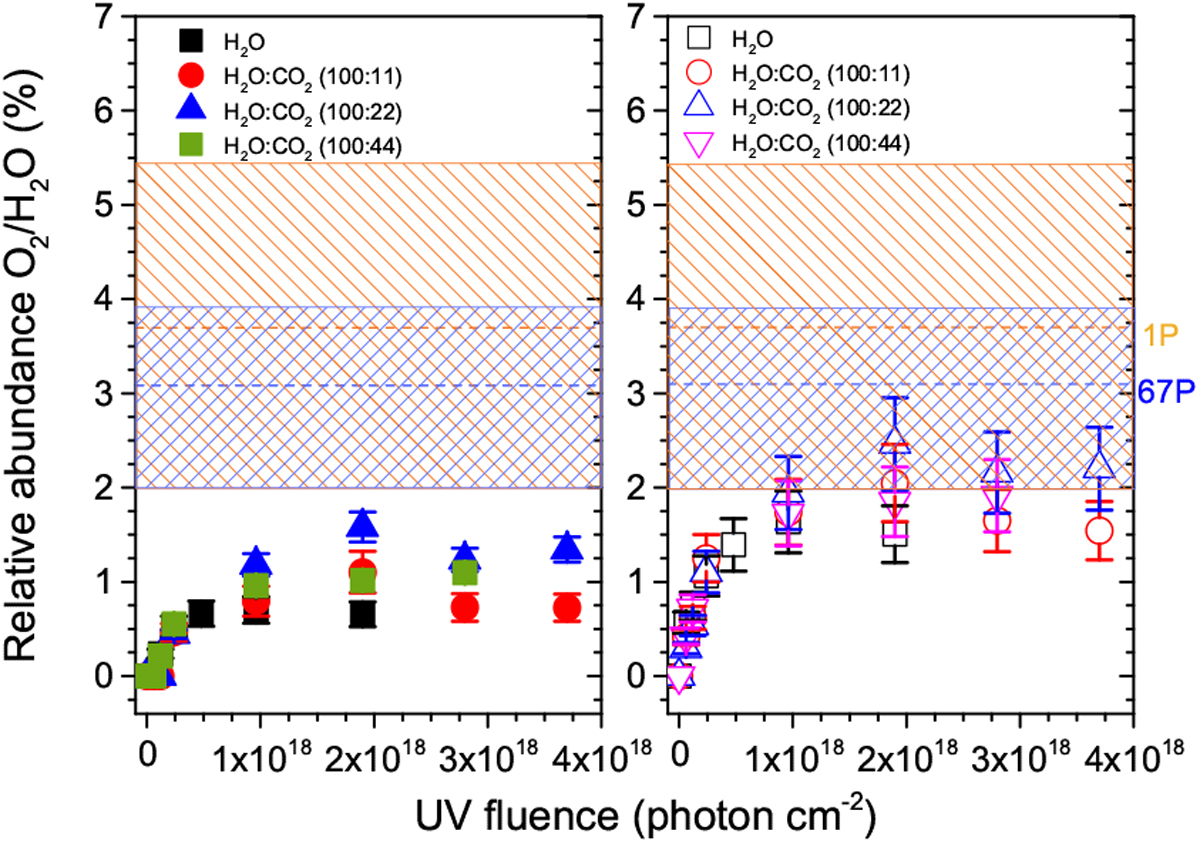
Striped areas represent relative O2/H2O abundances detected in cometary comae of 67P and 1P from Rubin et al. (2019). The data points represent the laboratory experiments presented here. Left panel: molecular abundance of O2 normalised to the amount of H2O at each UV dose for different initial compositions of the ice. Right panel: molecular abundance of O2 enhanced by the decomposition of H2O2 (see text fordetails).
Current usage metrics show cumulative count of Article Views (full-text article views including HTML views, PDF and ePub downloads, according to the available data) and Abstracts Views on Vision4Press platform.
Data correspond to usage on the plateform after 2015. The current usage metrics is available 48-96 hours after online publication and is updated daily on week days.
Initial download of the metrics may take a while.