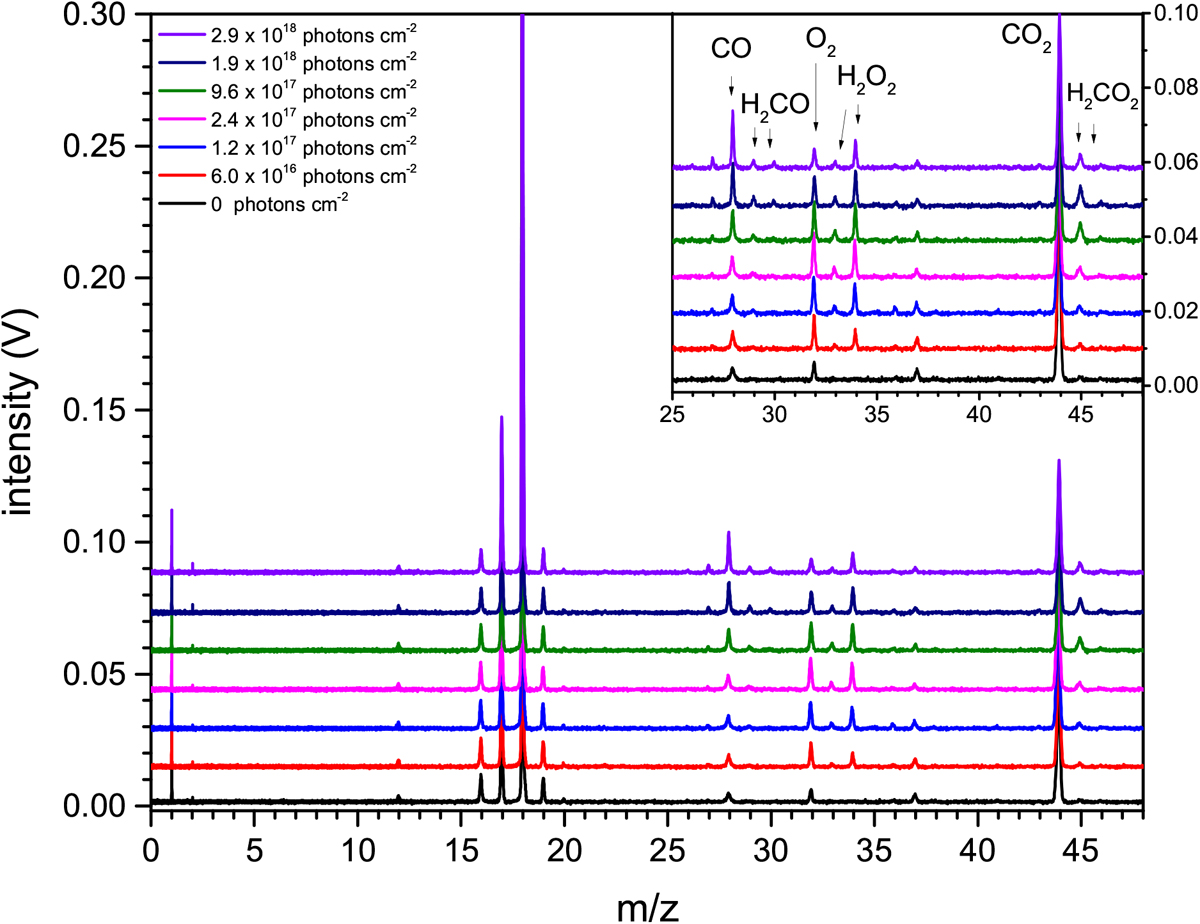
Fig. C.1
Download original image
LDPI TOF MS signals for a UV-irradiated H2O:CO2:O2 ice at 100:22:2 ratio at 20 K. The lowest graph shows the signal without UV irradiation. The inset shows a zoomed-in image of the intensity scale for the higher masses. Peaks at m∕z = 18⋅n+1, where n = 1, 2 represent protonated water clusters formed upon laser desorption of water ice and do not contribute to the chemistry in the ice.
Current usage metrics show cumulative count of Article Views (full-text article views including HTML views, PDF and ePub downloads, according to the available data) and Abstracts Views on Vision4Press platform.
Data correspond to usage on the plateform after 2015. The current usage metrics is available 48-96 hours after online publication and is updated daily on week days.
Initial download of the metrics may take a while.