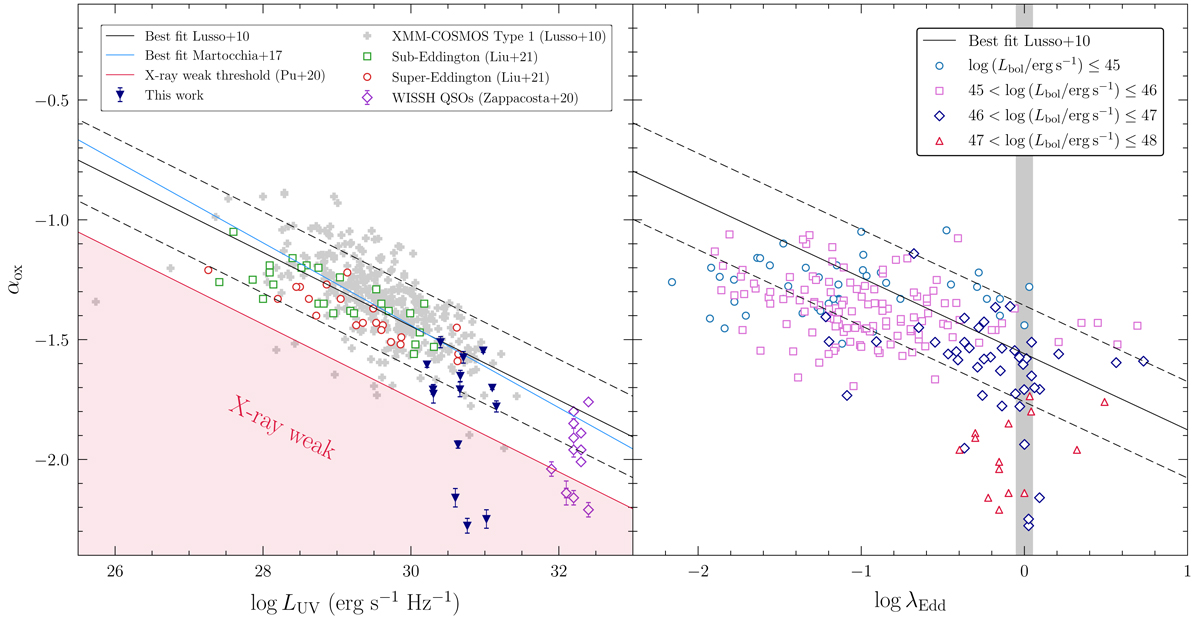
Fig. 5.
Download original image
Left panel: αox vs. log LUV for our high-λEdd AGN (blue triangles) compared to the XMM-COSMOS type-1 AGN (light grey crosses) of Lusso et al. (2010). The solid black line is the best-fit relation from the same authors. Dashed black lines describe the 1σ spread of the above relation. The solid blue line is the best-fit relation obtained from Martocchia et al. (2017). Green squares and red circles indicate the sub- and super-Eddington AGN from Liu et al. (2021), respectively. Purple diamonds are the 13 WISSH QSOs from Zappacosta et al. (2020). The red solid line marks the reference value for X-ray weakness, i.e. Δαox ≤ −0.3 (Pu et al. 2020). Right panel: distribution of the same sources described in the adjacent panel, divided into different regimes of bolometric luminosity, in the αox − log λEdd plane. For the XMM-COSMOS AGN sample, only those sources with available measurement of λEdd are included. The solid black line indicates the best-fit relation from Lusso et al. (2010). Dashed black lines describe the 1σ spread of the above relation. The shaded interval at log λEdd ∼ 0 is included to highlight that AGN with very similar values of λEdd can show a widespread distribution in αox due to their different Lbol.
Current usage metrics show cumulative count of Article Views (full-text article views including HTML views, PDF and ePub downloads, according to the available data) and Abstracts Views on Vision4Press platform.
Data correspond to usage on the plateform after 2015. The current usage metrics is available 48-96 hours after online publication and is updated daily on week days.
Initial download of the metrics may take a while.