Fig. 4.
Download original image
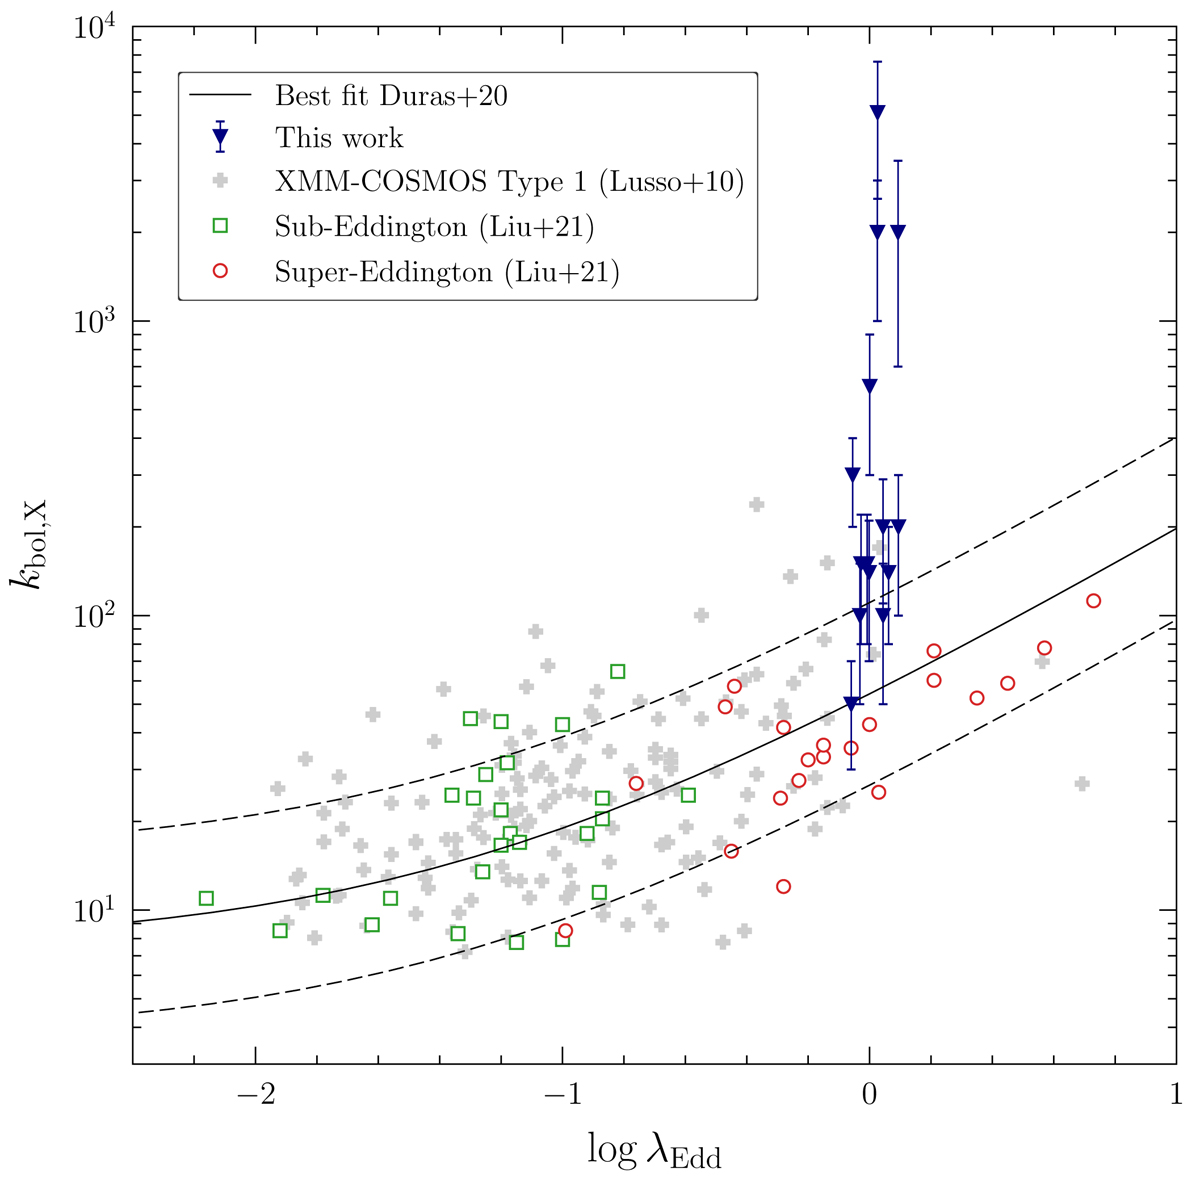
kbol, X vs. log λEdd for the high-λEdd AGN in our sample (blue triangles) compared to the XMM-COSMOS type-1 AGN (light grey crosses) of Lusso et al. (2010) with available Eddington ratio measurements. The solid black line refers to the best-fit relation from Duras et al. (2020). Dashed black lines describe the 1σ spread of the above relation. Green squares and red circles indicate the sub- and super-Eddington AGN from Liu et al. (2021), respectively.
Current usage metrics show cumulative count of Article Views (full-text article views including HTML views, PDF and ePub downloads, according to the available data) and Abstracts Views on Vision4Press platform.
Data correspond to usage on the plateform after 2015. The current usage metrics is available 48-96 hours after online publication and is updated daily on week days.
Initial download of the metrics may take a while.