Fig. 5
Download original image
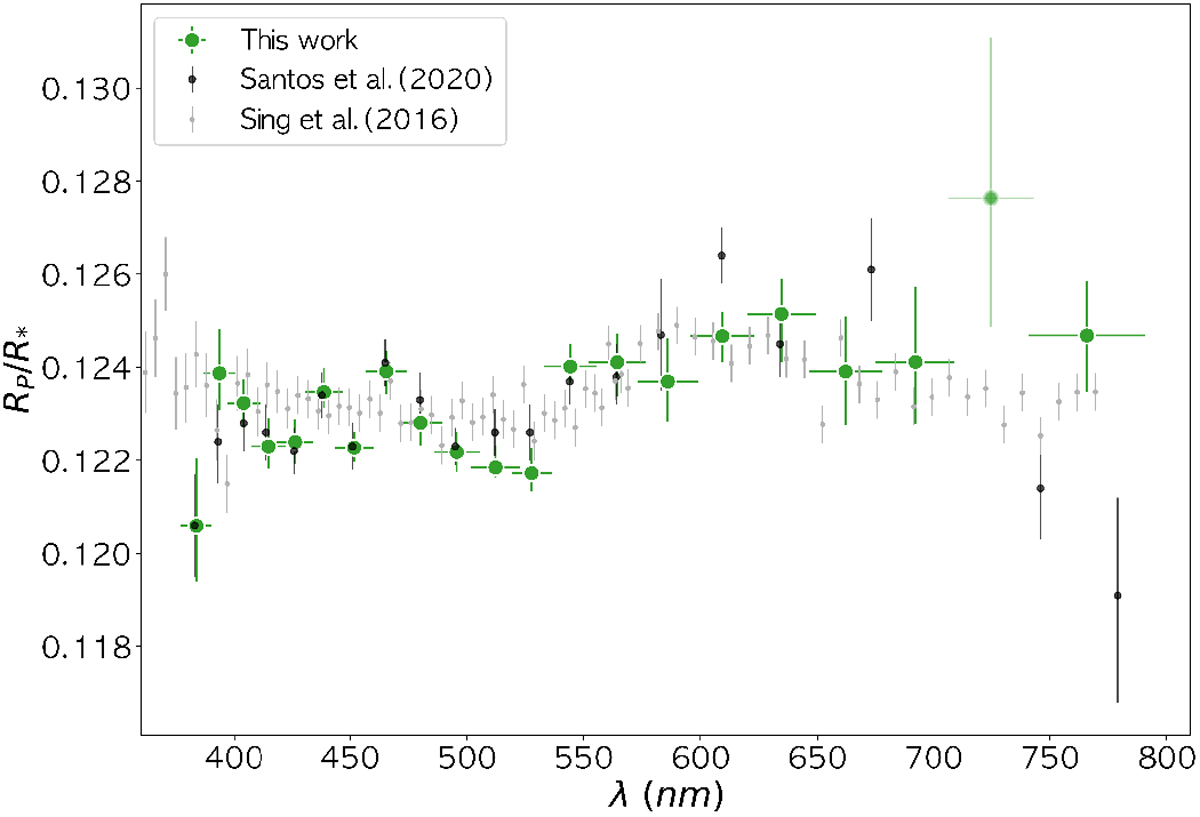
Comparison between the transmission spectra of HD 209458b obtained by Santos et al. (2020) (black circle), by Sing et al. (2016) (gray circle), and from our analysis (green circle). The x-axis error bars stand for the width of the wavelength bin, while the y-axis error bars stand for the uncertainties of the estimated planet-star radius ratio in each wavelength bin taken as the 1σ values of the posterior distributions from the fitting. We applied an offset to the values of the radius ratio obtained from our analysis, subtracting the average difference between our values and the Santos et al. (2020) values. Similarly, we introduced an offset to the Sing et al. (2016) data set to subtract the average difference with the Santos et al. (2020) values.
Current usage metrics show cumulative count of Article Views (full-text article views including HTML views, PDF and ePub downloads, according to the available data) and Abstracts Views on Vision4Press platform.
Data correspond to usage on the plateform after 2015. The current usage metrics is available 48-96 hours after online publication and is updated daily on week days.
Initial download of the metrics may take a while.