Fig. F.1
Download original image
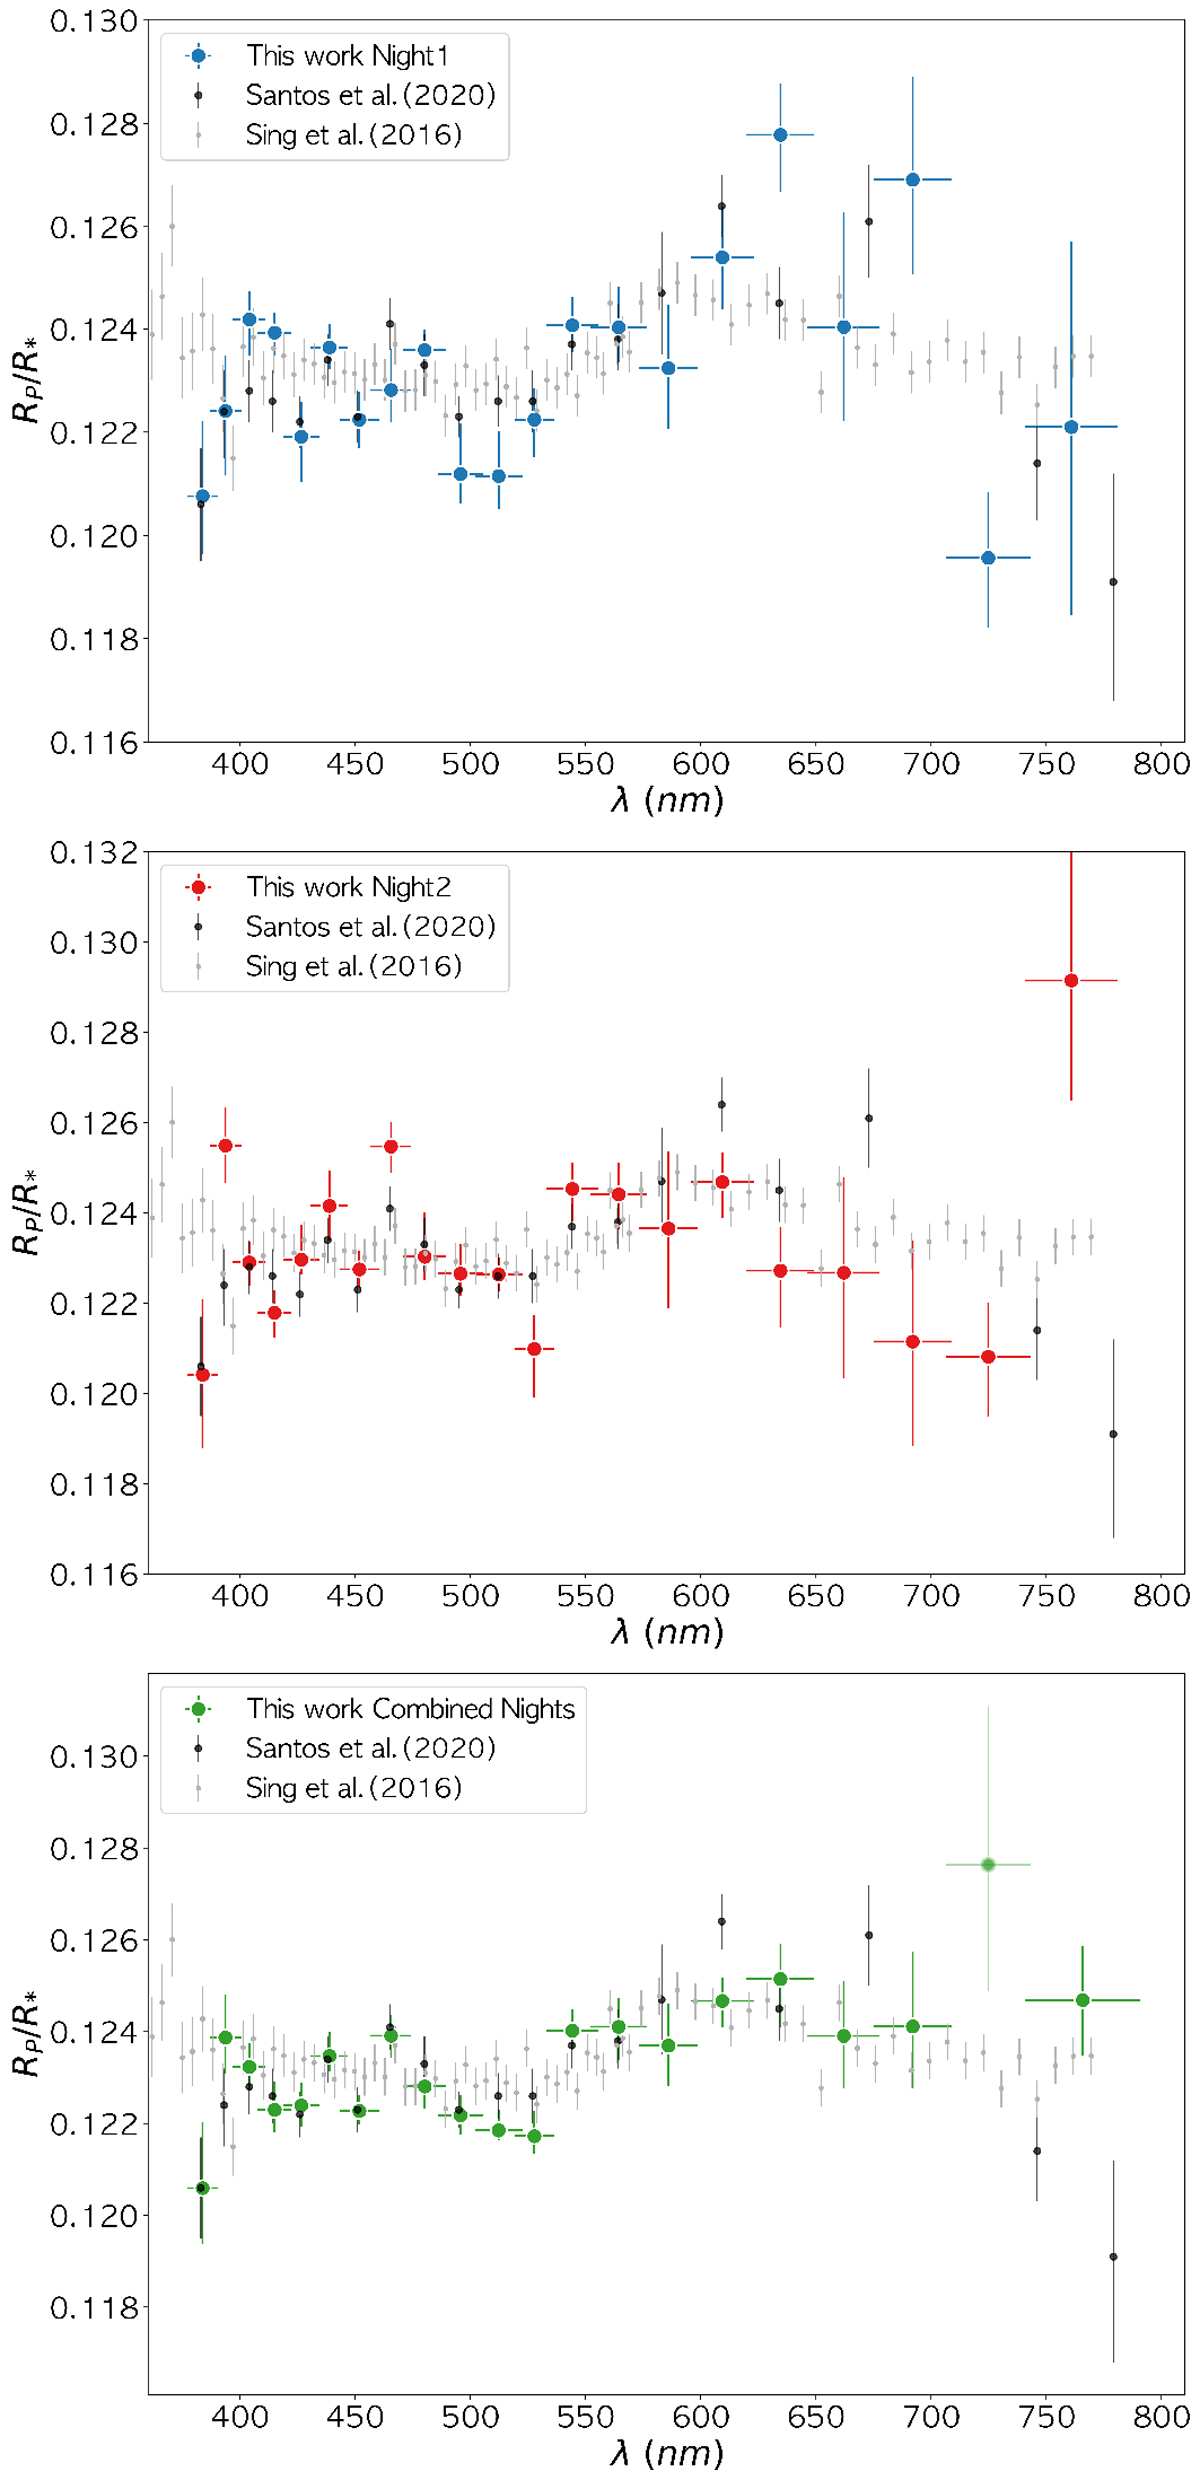
Transmission spectra of HD 209458b obtained from our analysis using Night 1 (top panel, blue circle), Night 2 (middle panel, red circle), and combined (bottom panel, green circle) data sets. Each result is compared to the transmission spectra obtained by Santos et al. (2020) (black circle) and Sing et al. (2016) (gray circle).
Current usage metrics show cumulative count of Article Views (full-text article views including HTML views, PDF and ePub downloads, according to the available data) and Abstracts Views on Vision4Press platform.
Data correspond to usage on the plateform after 2015. The current usage metrics is available 48-96 hours after online publication and is updated daily on week days.
Initial download of the metrics may take a while.