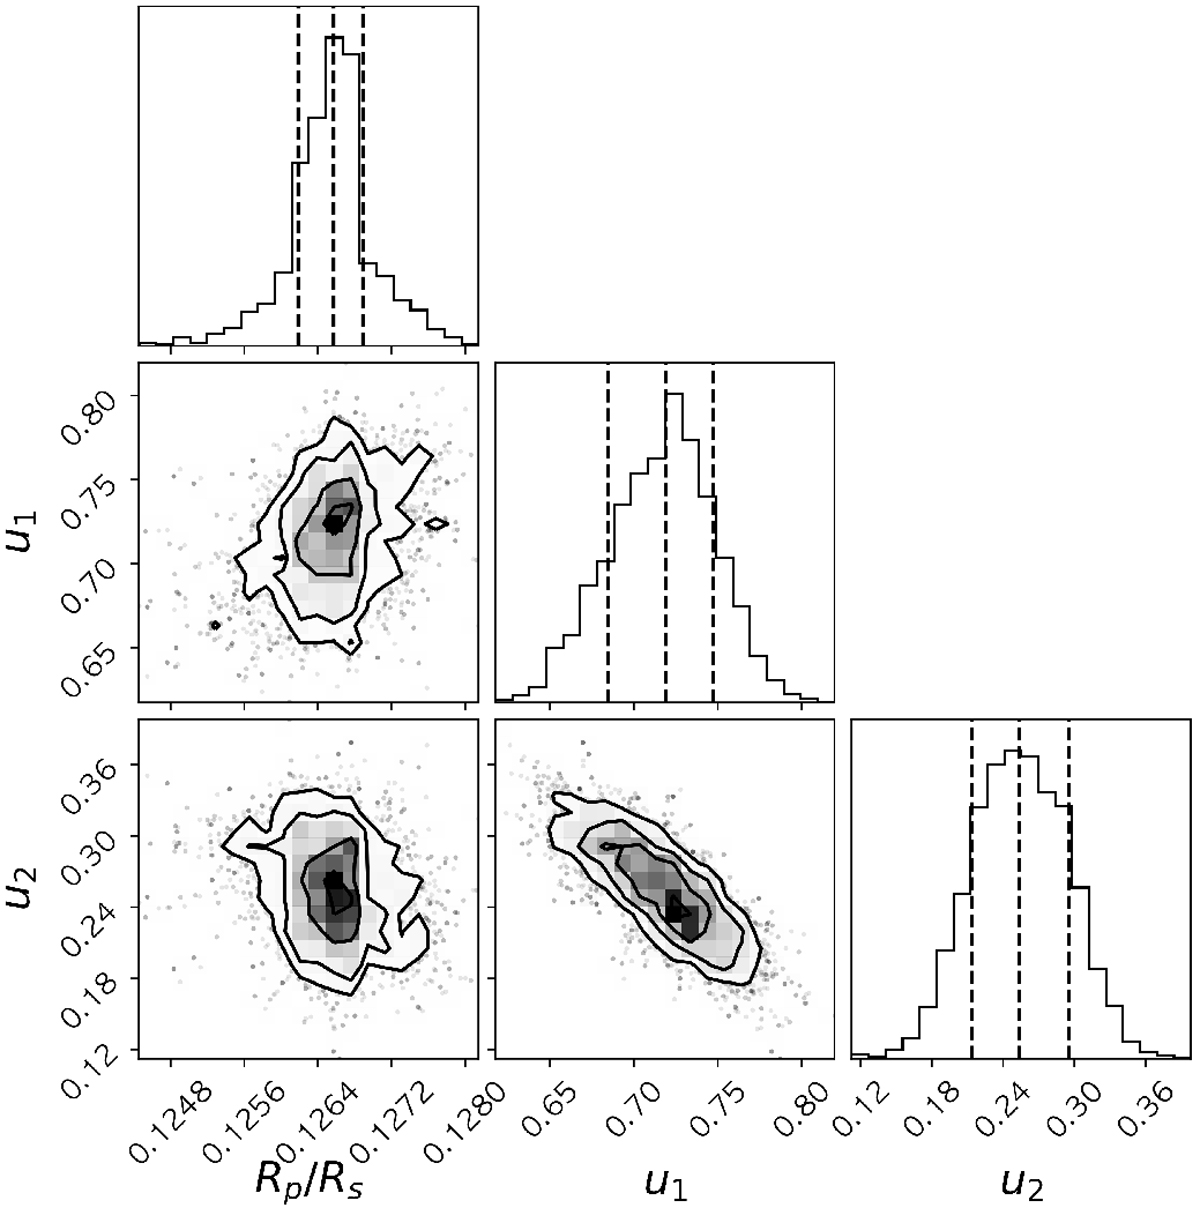
Fig. D.1
Download original image
Posterior distributions obtained through the fitting procedure using the 528-nanometer-centered bin as an example. The central dashed line indicates the best-fit value of each fitting parameter. The surrounding dashed lines mark the 1σ values of each distribution, which were taken to be the value enclosed in the 68.3% of the posterior distributions.
Current usage metrics show cumulative count of Article Views (full-text article views including HTML views, PDF and ePub downloads, according to the available data) and Abstracts Views on Vision4Press platform.
Data correspond to usage on the plateform after 2015. The current usage metrics is available 48-96 hours after online publication and is updated daily on week days.
Initial download of the metrics may take a while.