Free Access
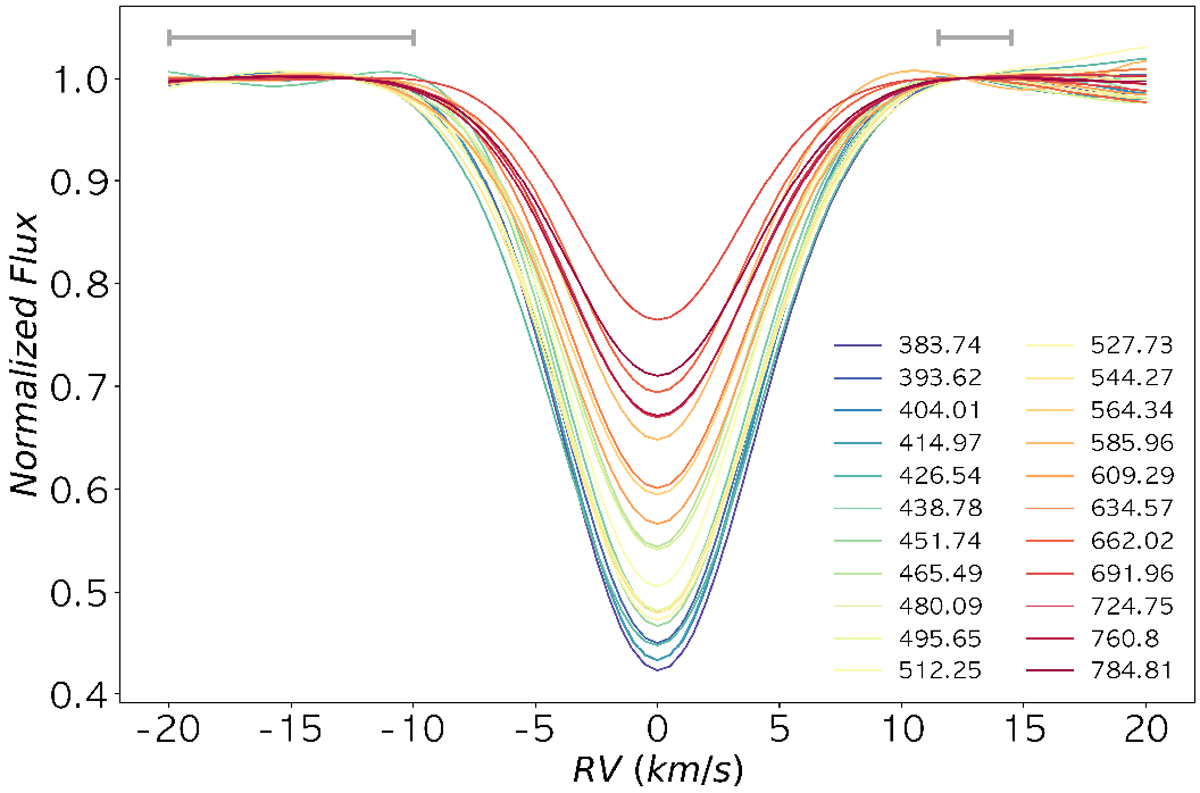
Fig. 1
Download original image
Master CCF of each bin (central wavelength of each bin given in nm) from the Night 1 eight-slice-bin data sets. The solid gray lines mark the continuum regions of the CCFs that were used in the normalization.
Current usage metrics show cumulative count of Article Views (full-text article views including HTML views, PDF and ePub downloads, according to the available data) and Abstracts Views on Vision4Press platform.
Data correspond to usage on the plateform after 2015. The current usage metrics is available 48-96 hours after online publication and is updated daily on week days.
Initial download of the metrics may take a while.