Open Access
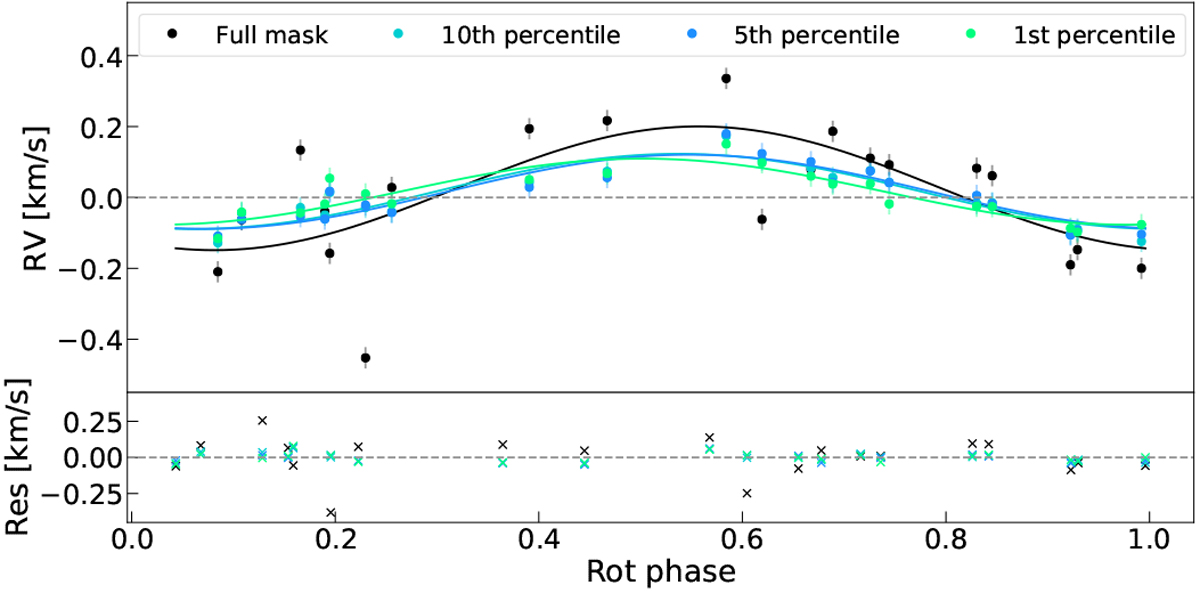
Fig. 5
Download original image
Output from an example run of the randomised selection. Shown are the 3σ clipped RV data sets computed using the full mask (black) and the sub-masks associated with the 10th (light blue), 5th (dark blue), and 1st (green) percentiles of the RV RMS distribution.
Current usage metrics show cumulative count of Article Views (full-text article views including HTML views, PDF and ePub downloads, according to the available data) and Abstracts Views on Vision4Press platform.
Data correspond to usage on the plateform after 2015. The current usage metrics is available 48-96 hours after online publication and is updated daily on week days.
Initial download of the metrics may take a while.