Fig. 9
Download original image
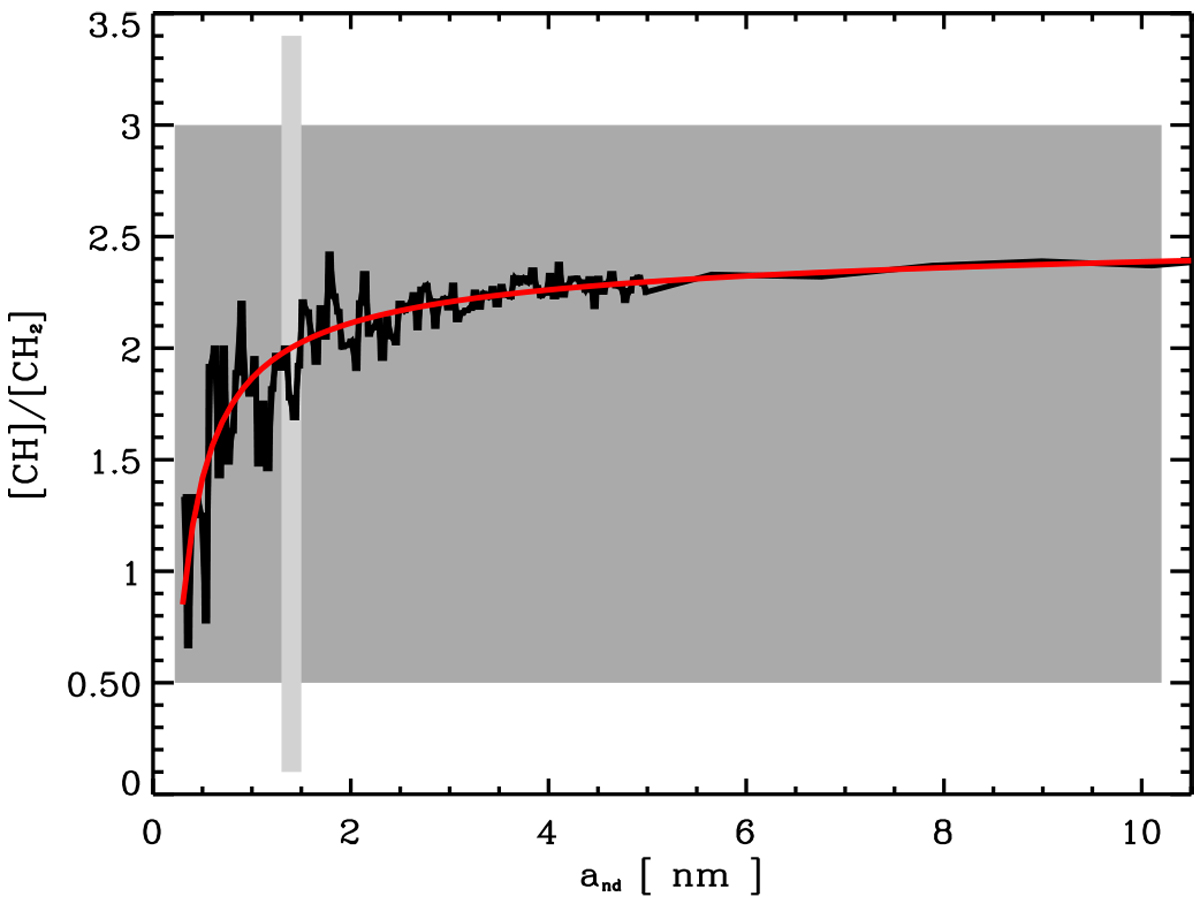
[CH]/[CH2] ratios for ‘spherical’ nano-diamonds with actual radii ≤10 nm (black line), showing the inherent dispersion in the data. The red line shows the analytical approximation to these data (see text for details). The grey shaded gives an indication of the observed and experimental values (0.5–3) and the lighter grey verticalband indicates the typical radii of the most abundant pre-solar nano-diamonds (1.3–1.5 nm).
Current usage metrics show cumulative count of Article Views (full-text article views including HTML views, PDF and ePub downloads, according to the available data) and Abstracts Views on Vision4Press platform.
Data correspond to usage on the plateform after 2015. The current usage metrics is available 48-96 hours after online publication and is updated daily on week days.
Initial download of the metrics may take a while.