Free Access
Fig. 5.
Download original image
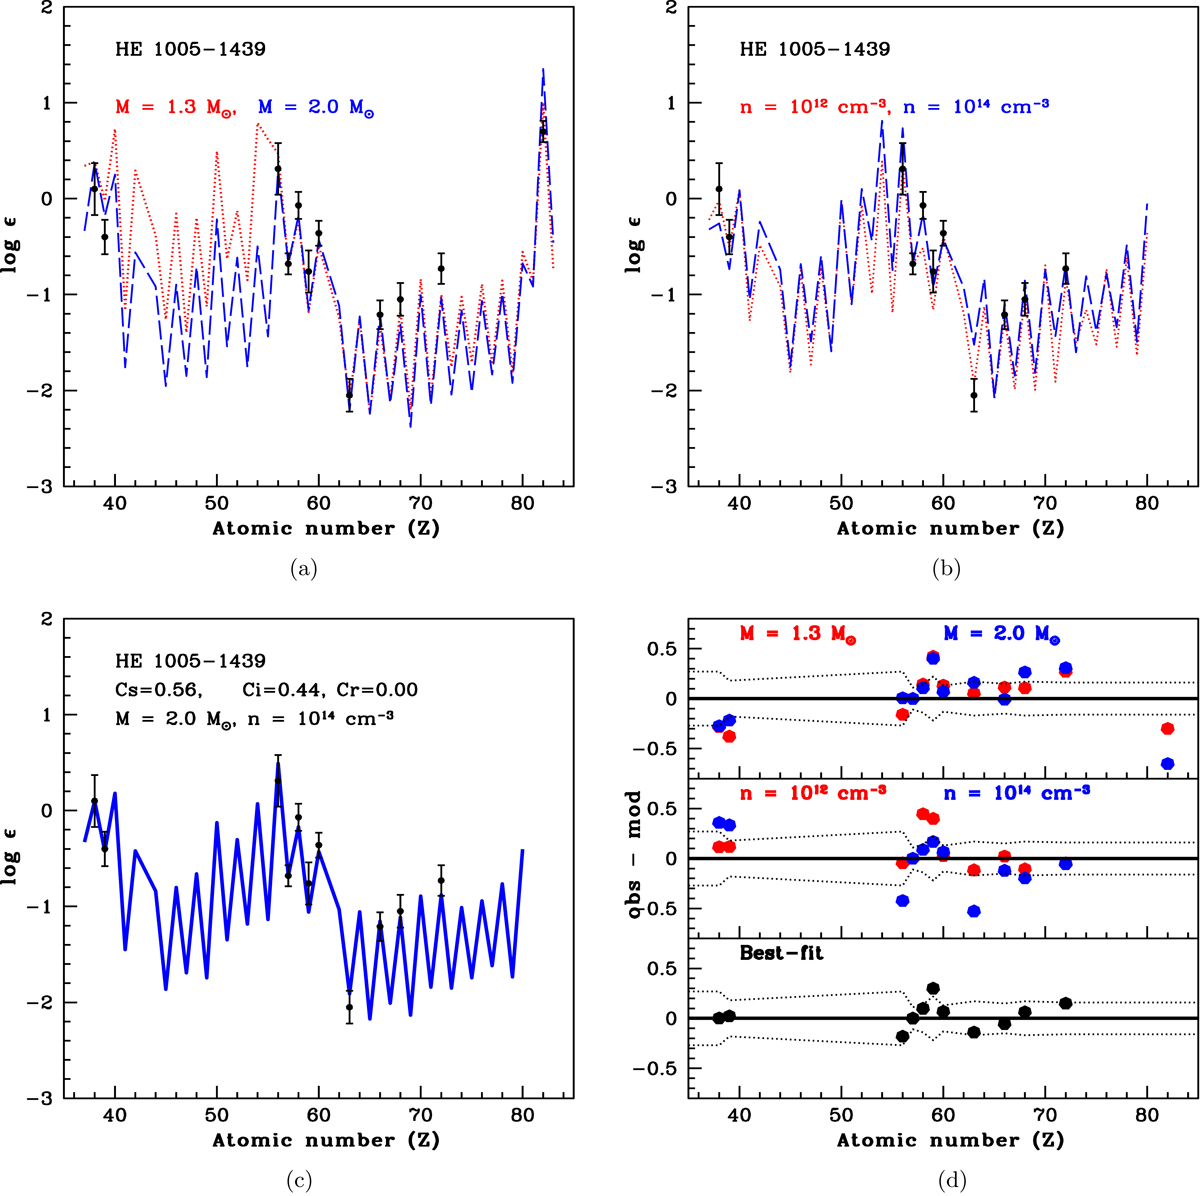
Examples of theoretical model fits with the observed abundances of the star. In panels a, b, and c, the points with error bars indicate the observed abundances. (a) s-process model fits for M = 1.3 M⊙ & 2.0 M⊙. (b) i-process model fits for n = 1012 cm−3 and 1014 cm−3. (c) Best-fit from parametric-model. (d) Residual plot.
Current usage metrics show cumulative count of Article Views (full-text article views including HTML views, PDF and ePub downloads, according to the available data) and Abstracts Views on Vision4Press platform.
Data correspond to usage on the plateform after 2015. The current usage metrics is available 48-96 hours after online publication and is updated daily on week days.
Initial download of the metrics may take a while.