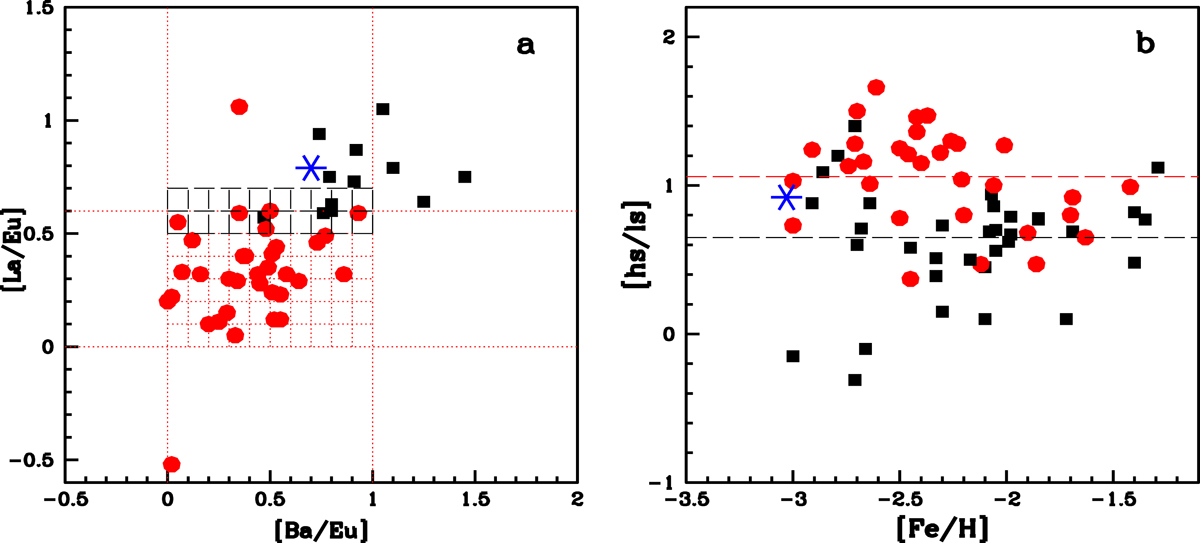
Fig. 4.
Download original image
Filled red circles and filled black squares respectively represent literature CEMP-r/s and CEMP-s stars compiled by Goswami et al. (2021), and the blue star represents the programme star. Panel a: grid formed by the dotted red lines bound by 0.0 < [La/Eu] < 0.6 and 0.0 < [Ba/Eu] < 1.0 indicates the region defined for CEMP-r/s stars by Goswami et al. (2021). The grid formed by the black dashed lines bound by 0.5 < [La/Eu] < 0.7 represents the region where [Eu/Fe] > 1.0 classifies the stars as CEMP-r/s and [Eu/Fe] < 1.0 classifies the stars as CEMP-s. Panel b: red dashed line at [hs/ls] = 1.06 and the black dashed line at [hs/ls] = 0.65 represent the peaks of [hs/ls] for CEMP-r/s and CEMP-s, respectively, as shown by Goswami et al. (2021) in Fig. 13a.
Current usage metrics show cumulative count of Article Views (full-text article views including HTML views, PDF and ePub downloads, according to the available data) and Abstracts Views on Vision4Press platform.
Data correspond to usage on the plateform after 2015. The current usage metrics is available 48-96 hours after online publication and is updated daily on week days.
Initial download of the metrics may take a while.