Fig. 3.
Download original image
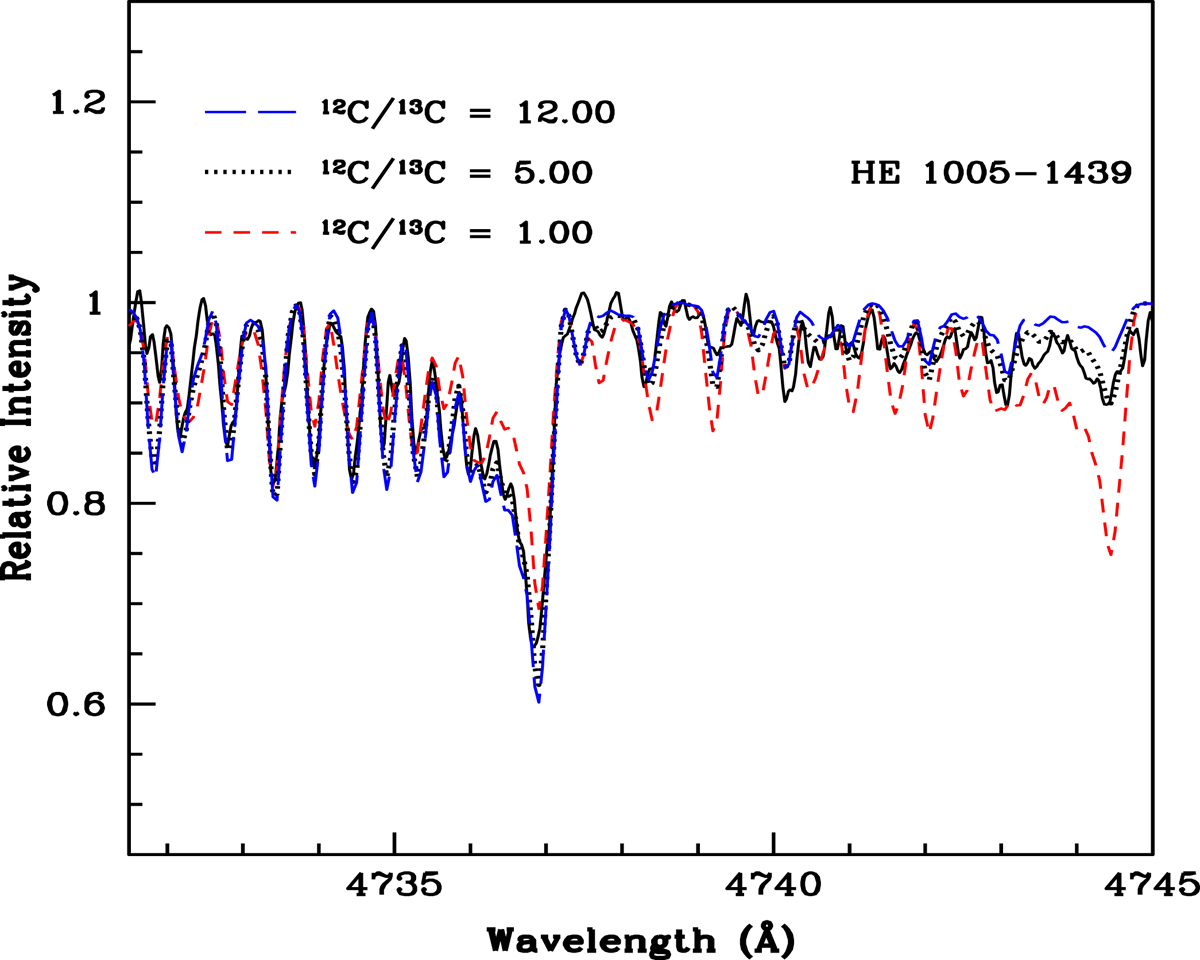
Spectral synthesis fits (dotted curves) of the C2 features around 4740 Å obtained with the adopted C abundance and 12C/13C value (dotted curve). The observed spectrum is shown by a solid curve. Two alternative fits with 12C/13C ∼ 1 (short-dashed line) and 12 (long-dashed line) are shown to illustrate the sensitivity of the line strengths to the isotopic carbon abundance ratios.
Current usage metrics show cumulative count of Article Views (full-text article views including HTML views, PDF and ePub downloads, according to the available data) and Abstracts Views on Vision4Press platform.
Data correspond to usage on the plateform after 2015. The current usage metrics is available 48-96 hours after online publication and is updated daily on week days.
Initial download of the metrics may take a while.