Fig. 6.
Download original image
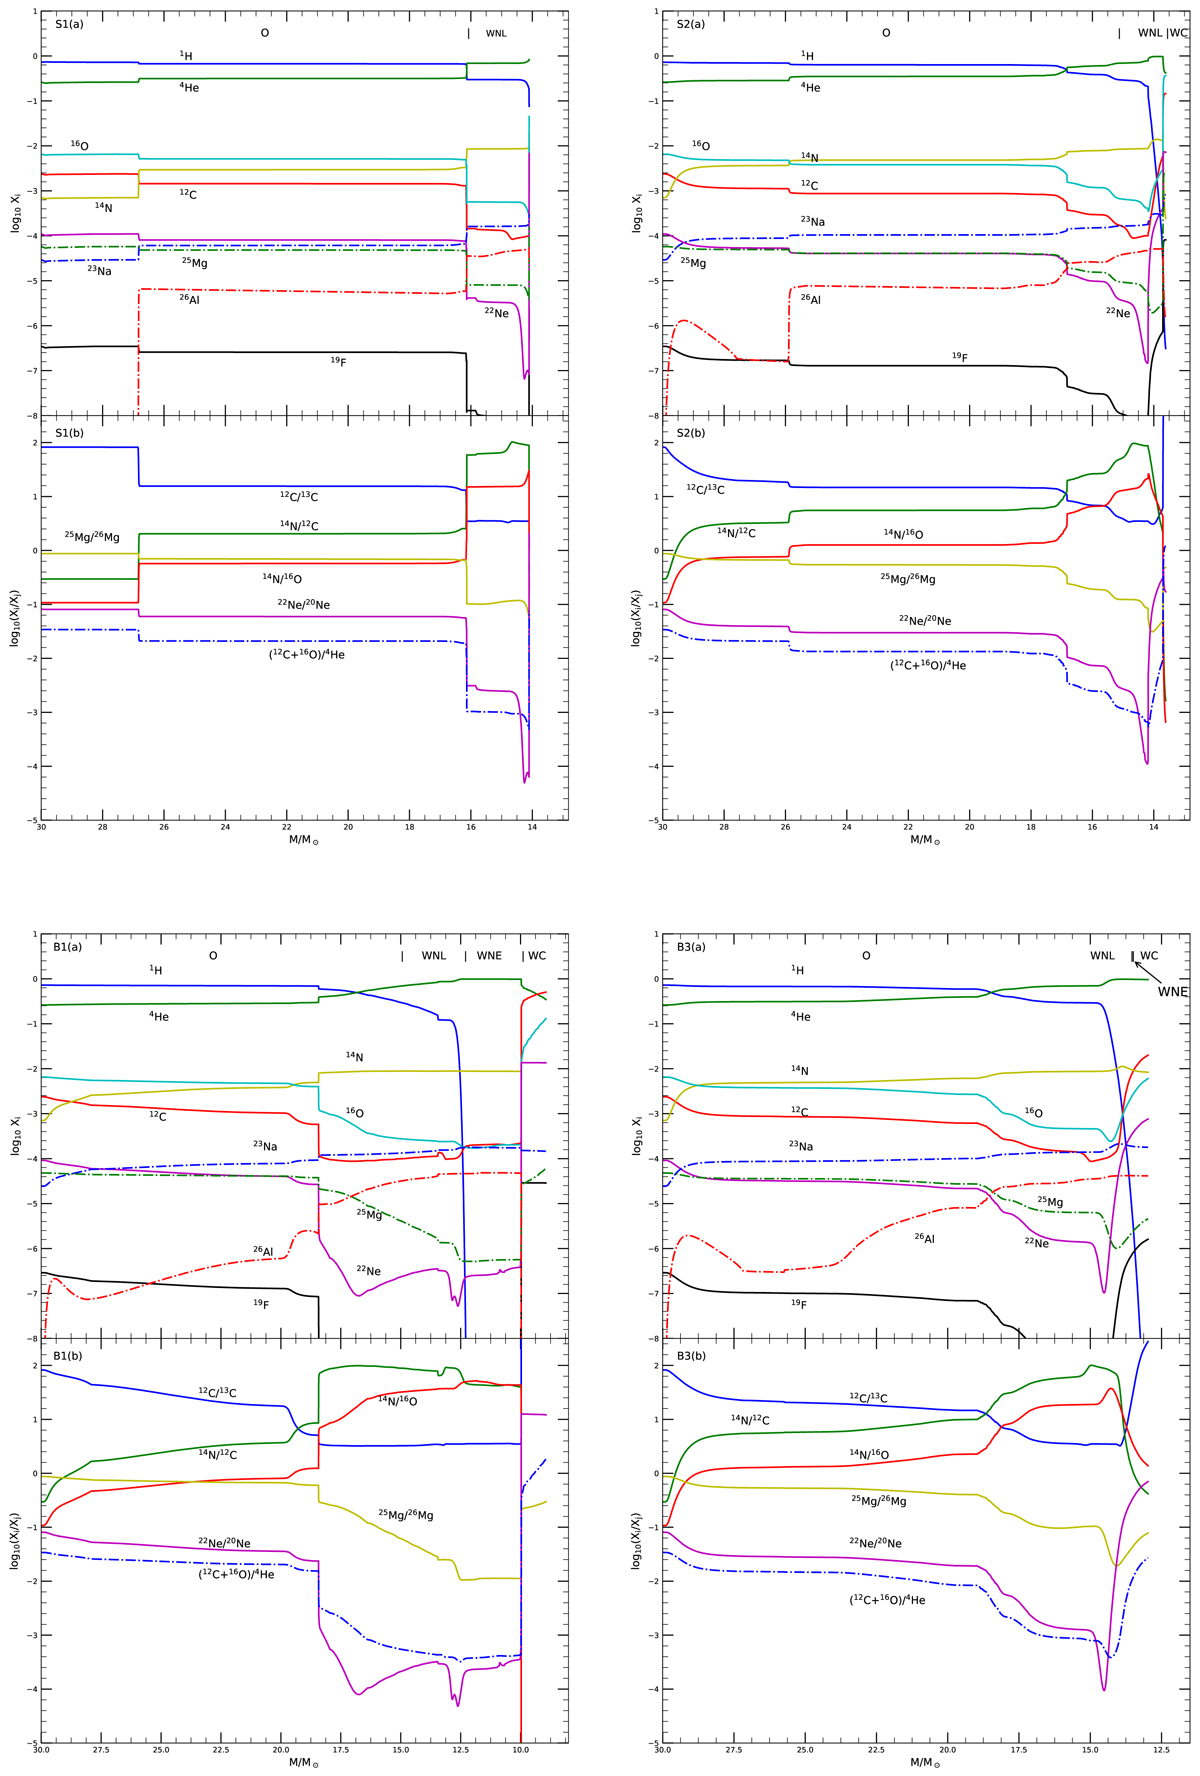
Panel S1 (a): evolution of the surface abundances in mass fraction as a function of the actual mass of the star for the nonrotating single star S1 with 30 M⊙. Different evolutionary phases are indicated in the upper part of the figure. Panel S1 (b): evolution of abundance ratios in number as a function of the actual mass of the star S1. Panels S2 (a) and S2 (b): same as panels S1 (a) and S1 (b) but for the rotating model S2. Panels B1 (a) and B1 (b): same as the panels S1 (a) and S1 (b) but for the primary star in model B1 with initial Porb = 6.0 days. Panels B3 (a) and B3 (b): same as the panels S1 (a) and S1 (b) for the primary star in model B3 with initial Porb = 1000.0 days.
Current usage metrics show cumulative count of Article Views (full-text article views including HTML views, PDF and ePub downloads, according to the available data) and Abstracts Views on Vision4Press platform.
Data correspond to usage on the plateform after 2015. The current usage metrics is available 48-96 hours after online publication and is updated daily on week days.
Initial download of the metrics may take a while.