Fig. 9
Download original image
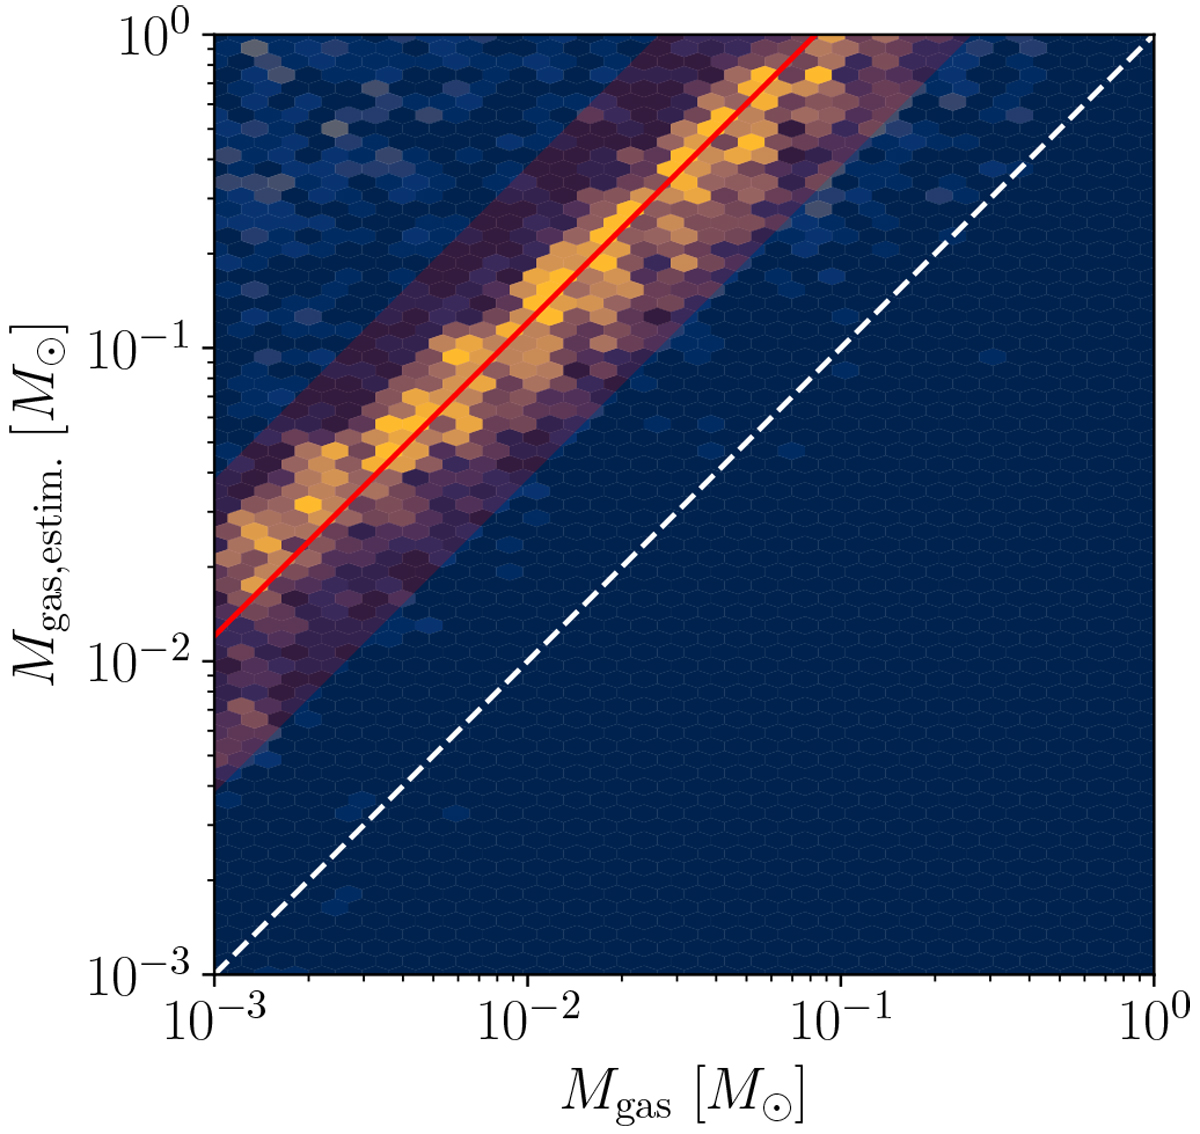
Comparison between input disk masses and the estimates from the dust line location. The shaded red area includes the best 68% of the disks, the red line is the median mass of these disks, and the white line is the correlation function for a perfect match. The dust line location systematically overestimates the disk mass by about one order of magnitude.
Current usage metrics show cumulative count of Article Views (full-text article views including HTML views, PDF and ePub downloads, according to the available data) and Abstracts Views on Vision4Press platform.
Data correspond to usage on the plateform after 2015. The current usage metrics is available 48-96 hours after online publication and is updated daily on week days.
Initial download of the metrics may take a while.