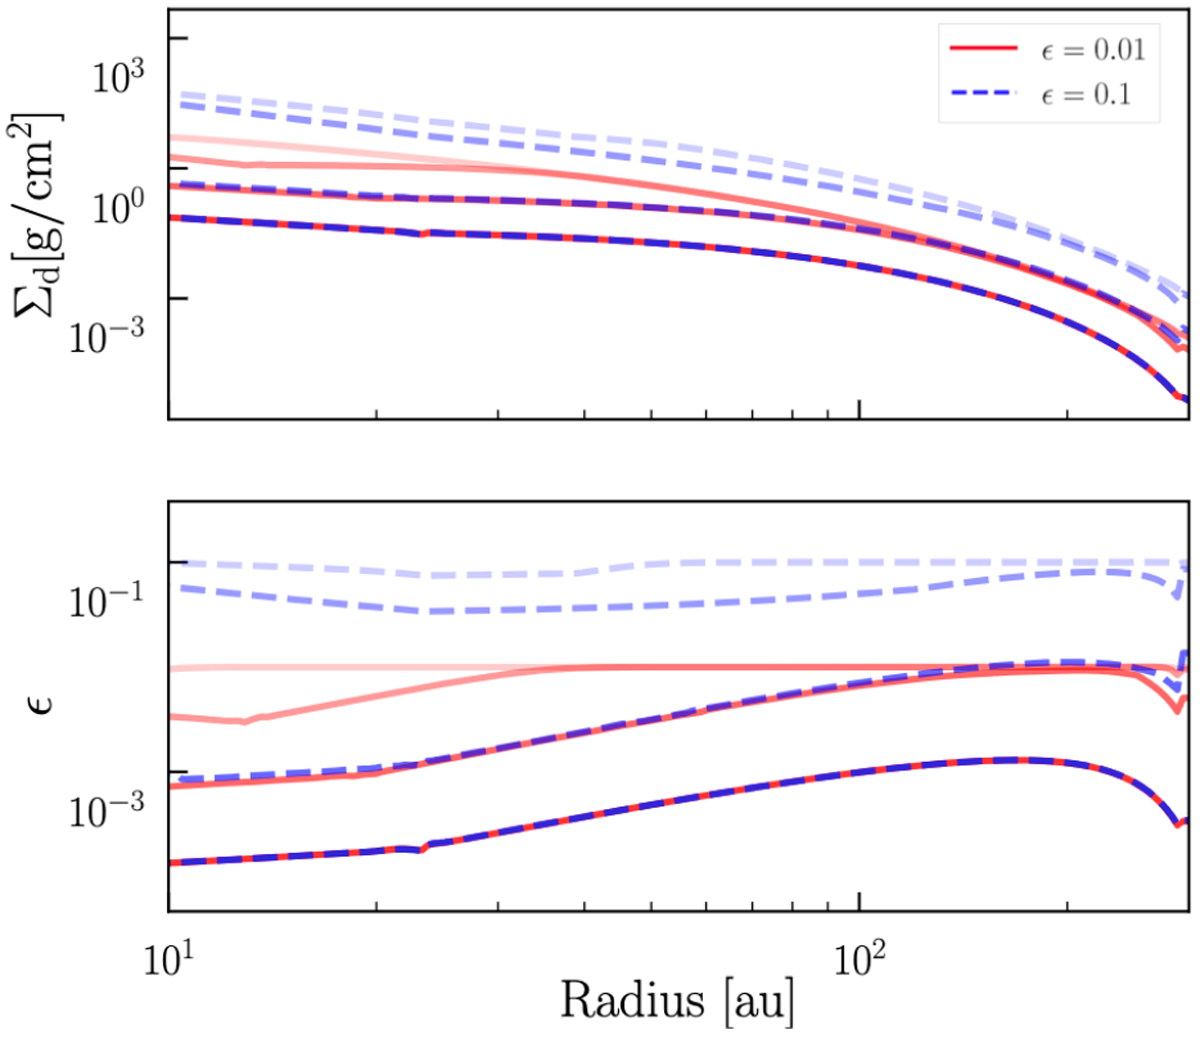
Fig. 7
Download original image
Time evolution, between 1 Myr and 5 Myr, of the dust surface density distribution (top) and the dust-to-gas ratio (bottom) assuming an initial dust-to-gas ratio of 0.01 (red) and 0.1 (blue), with darker lines for older ages. This plot shows how most of the dust evolution happens within the first few Myr. After that the dust density profile and the dust-to-gas ratio are independent of the assumed initial dust-to-gas ratio.
Current usage metrics show cumulative count of Article Views (full-text article views including HTML views, PDF and ePub downloads, according to the available data) and Abstracts Views on Vision4Press platform.
Data correspond to usage on the plateform after 2015. The current usage metrics is available 48-96 hours after online publication and is updated daily on week days.
Initial download of the metrics may take a while.