Open Access
Fig. 16
Download original image
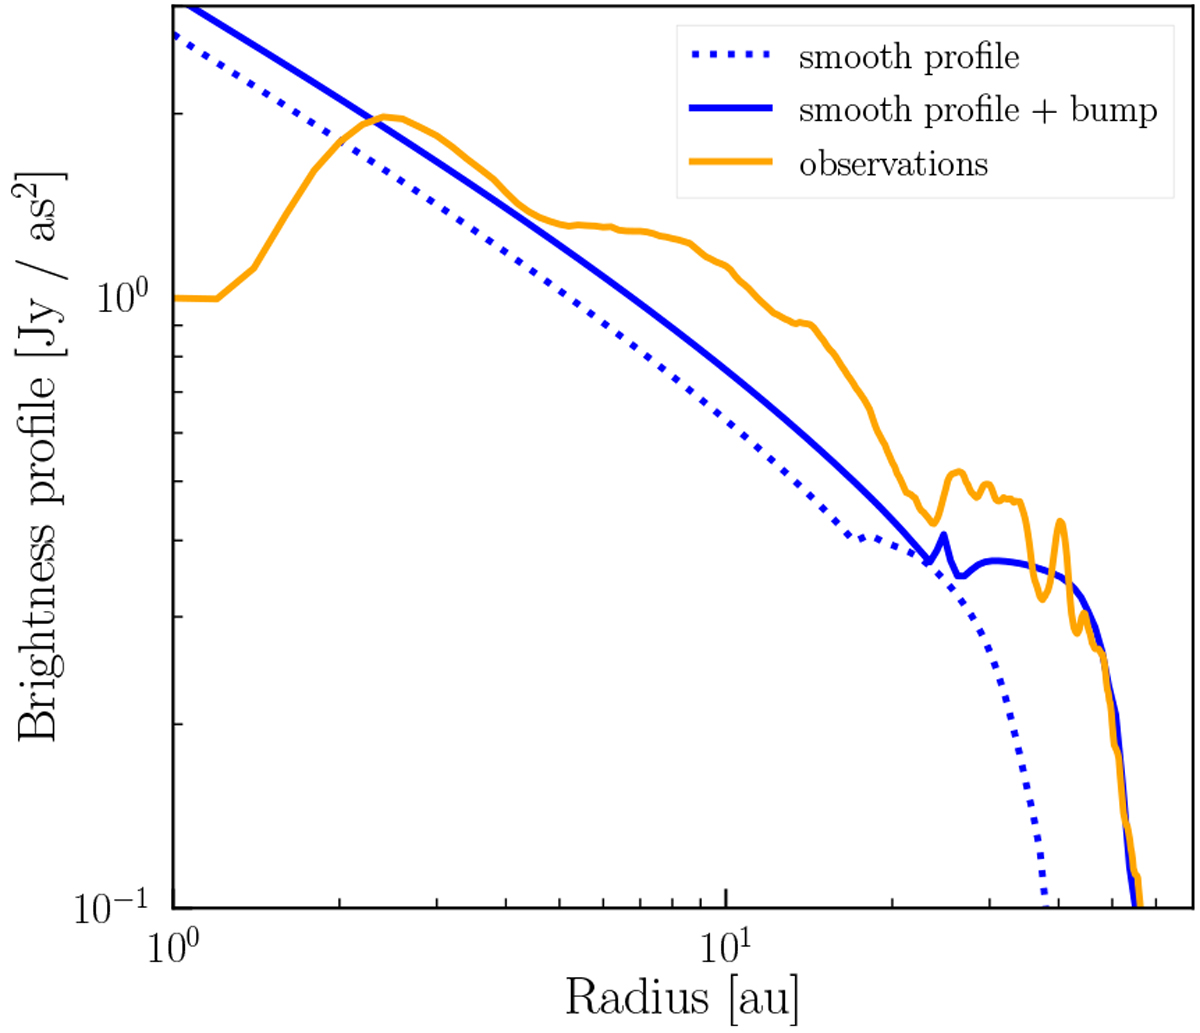
Comparison of the dust continuum emission at 0.87 mm as predicted by our model (blue solid line) and the observational data (orange solid line) from Andrews et al. (2016). The blue dotted line shows the model result without accounting for radial structures, highlighting their importance for this mass estimate.
Current usage metrics show cumulative count of Article Views (full-text article views including HTML views, PDF and ePub downloads, according to the available data) and Abstracts Views on Vision4Press platform.
Data correspond to usage on the plateform after 2015. The current usage metrics is available 48-96 hours after online publication and is updated daily on week days.
Initial download of the metrics may take a while.