Fig. 12
Download original image
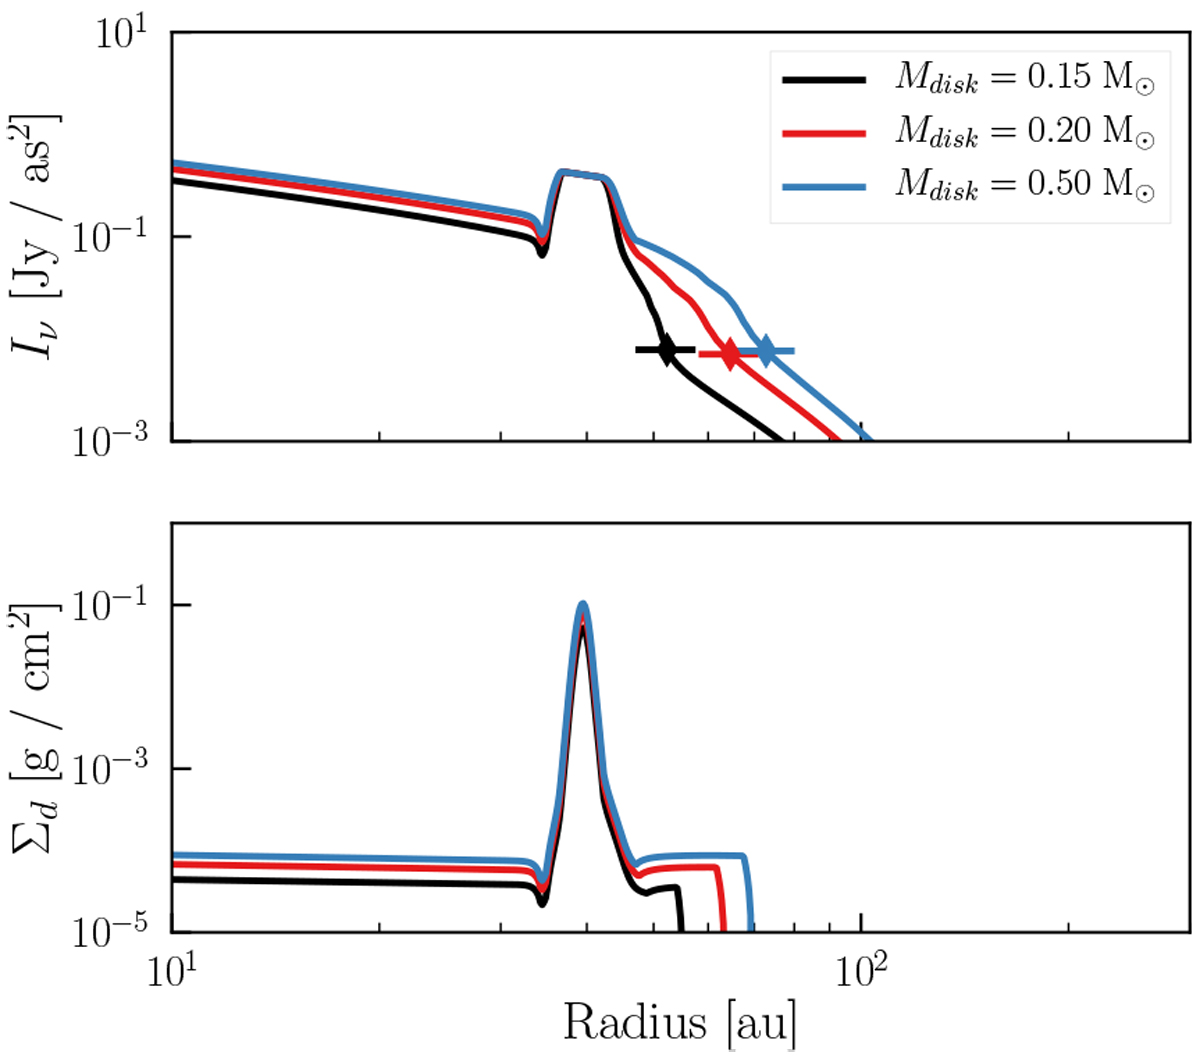
Dependence of the dust line location on the disk mass in the presence of a strong bump in the gas density at 40 au. The upper plot shows the dust emission profile at λ = 0.87 mm, as predicted by the model. The dust line location, as defined in the text, is highlighted on the profiles. The lower plot shows the surface density distribution of the most emitting grains. The dust line location in the first plot matches the outer edge of the density distribution in the lower plot for the same disk mass.
Current usage metrics show cumulative count of Article Views (full-text article views including HTML views, PDF and ePub downloads, according to the available data) and Abstracts Views on Vision4Press platform.
Data correspond to usage on the plateform after 2015. The current usage metrics is available 48-96 hours after online publication and is updated daily on week days.
Initial download of the metrics may take a while.