Fig. 3
Download original image
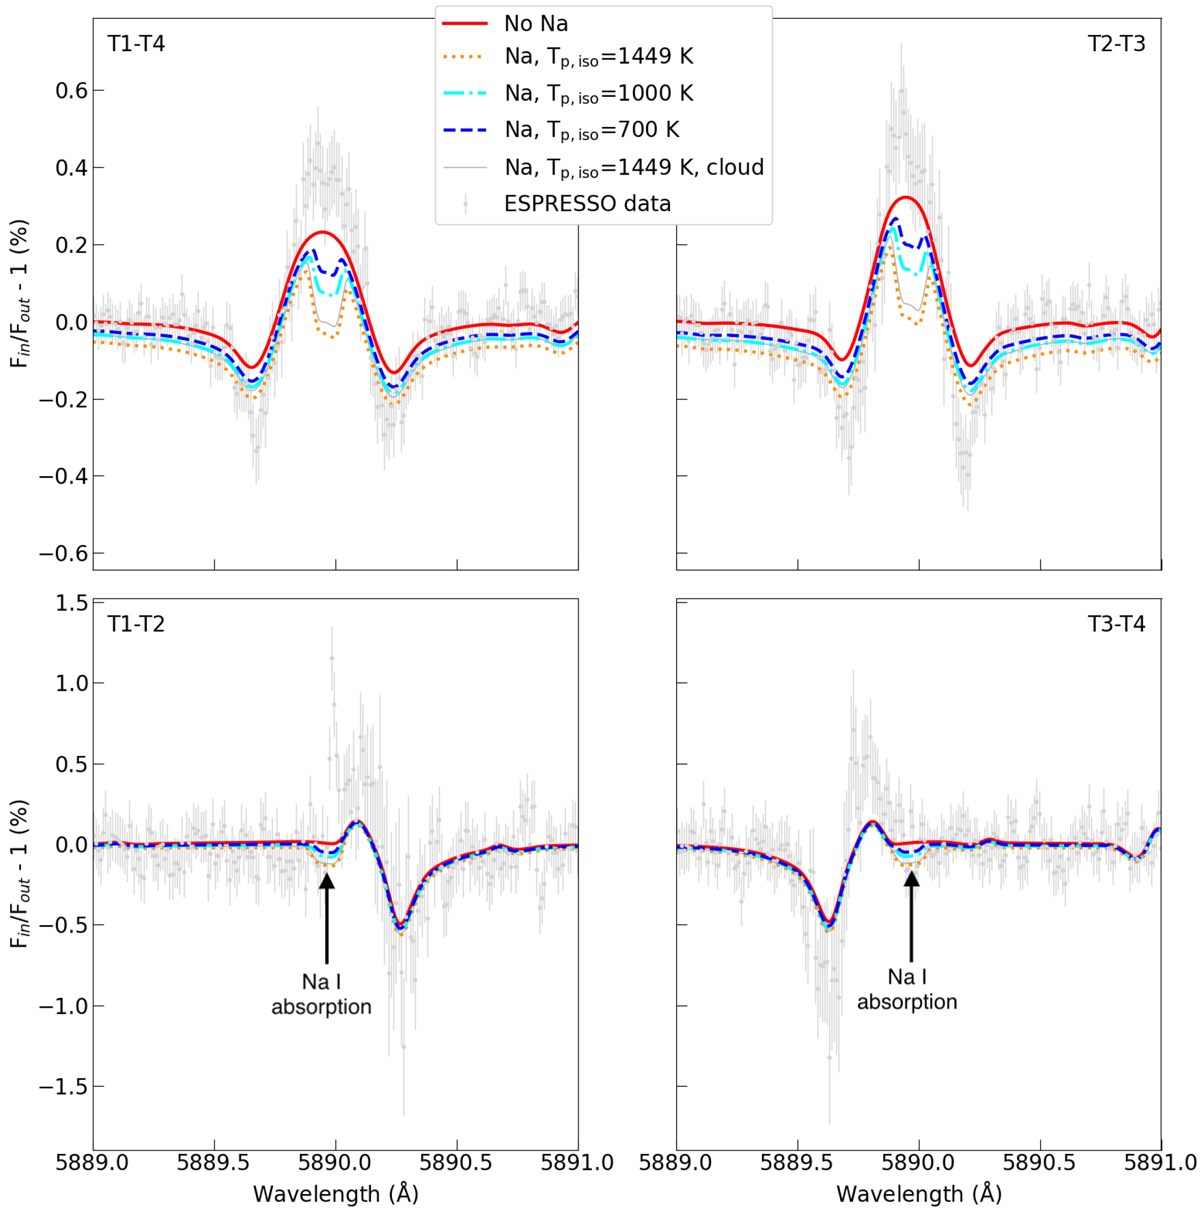
Simulated transmission spectra of HD 209458 b around the Na I D1 line, showing the RM+CLV effects along with atmospheric absorption. The spectra are computed in the planet rest frame and averaged between transit contact points as indicated in the top left or top right corner of each panel. The different colours correspond to the same atmospheric models represented in Fig. 2. The ESPRESSO data are the same as those reported in Fig. 5 of Casasayas-Barris et al. (2021).
Current usage metrics show cumulative count of Article Views (full-text article views including HTML views, PDF and ePub downloads, according to the available data) and Abstracts Views on Vision4Press platform.
Data correspond to usage on the plateform after 2015. The current usage metrics is available 48-96 hours after online publication and is updated daily on week days.
Initial download of the metrics may take a while.