Free Access
Fig. 7
Download original image
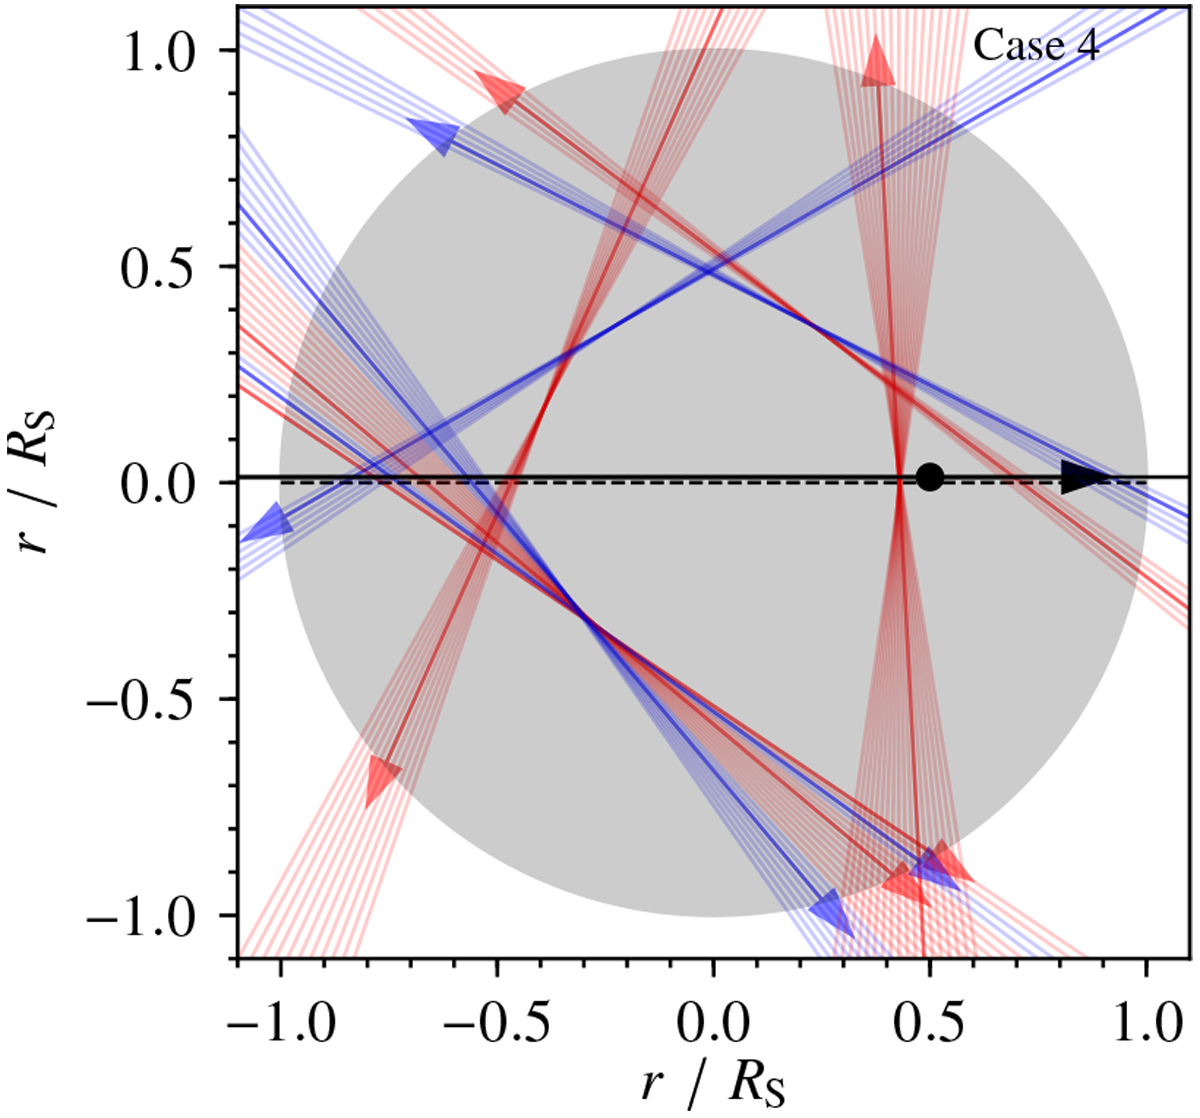
Transit paths of Kepler-20 b for which simulated PPOs occur. Orbital motion indicated by arrows for angles α4 (Table 4). Orbits in red indicate Δχ2 > 0, and in blue Δχ2 < 0. The stellar equator is marked with a dashed line, while planet c is shown as a black dot.
Current usage metrics show cumulative count of Article Views (full-text article views including HTML views, PDF and ePub downloads, according to the available data) and Abstracts Views on Vision4Press platform.
Data correspond to usage on the plateform after 2015. The current usage metrics is available 48-96 hours after online publication and is updated daily on week days.
Initial download of the metrics may take a while.