Fig. 5
Download original image
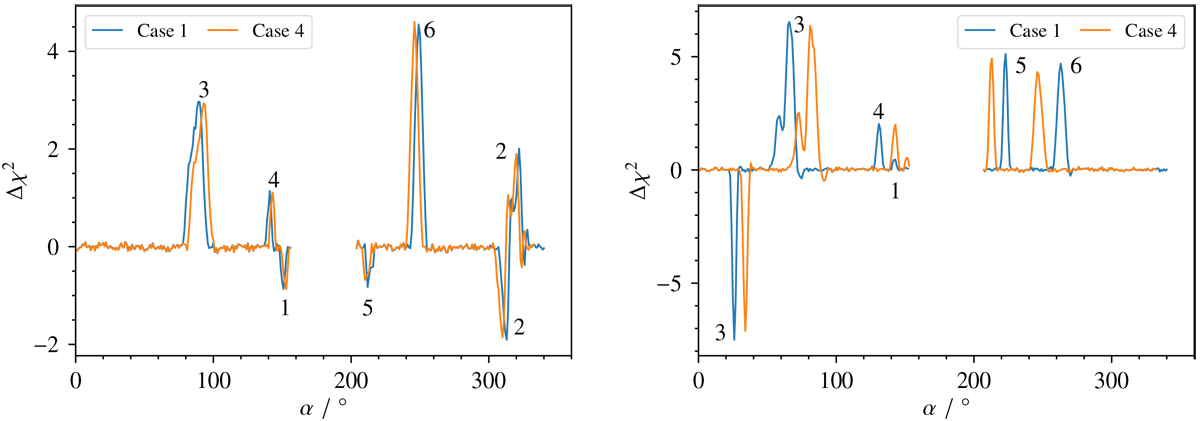
Change of the χ2 value between model and data as a function of the orbital tilt angle α. The left panel shows the results for simulations carried out with our transit parameter fits, while the right panel holds results when transit parameters from Buchhave et al. (2016) are used. The two simulated cases are shownin different colors (labels). The numbers indicate the transit in which artificial PPOs lead to Δχ2 ≠ 0.
Current usage metrics show cumulative count of Article Views (full-text article views including HTML views, PDF and ePub downloads, according to the available data) and Abstracts Views on Vision4Press platform.
Data correspond to usage on the plateform after 2015. The current usage metrics is available 48-96 hours after online publication and is updated daily on week days.
Initial download of the metrics may take a while.