Fig. 4
Download original image
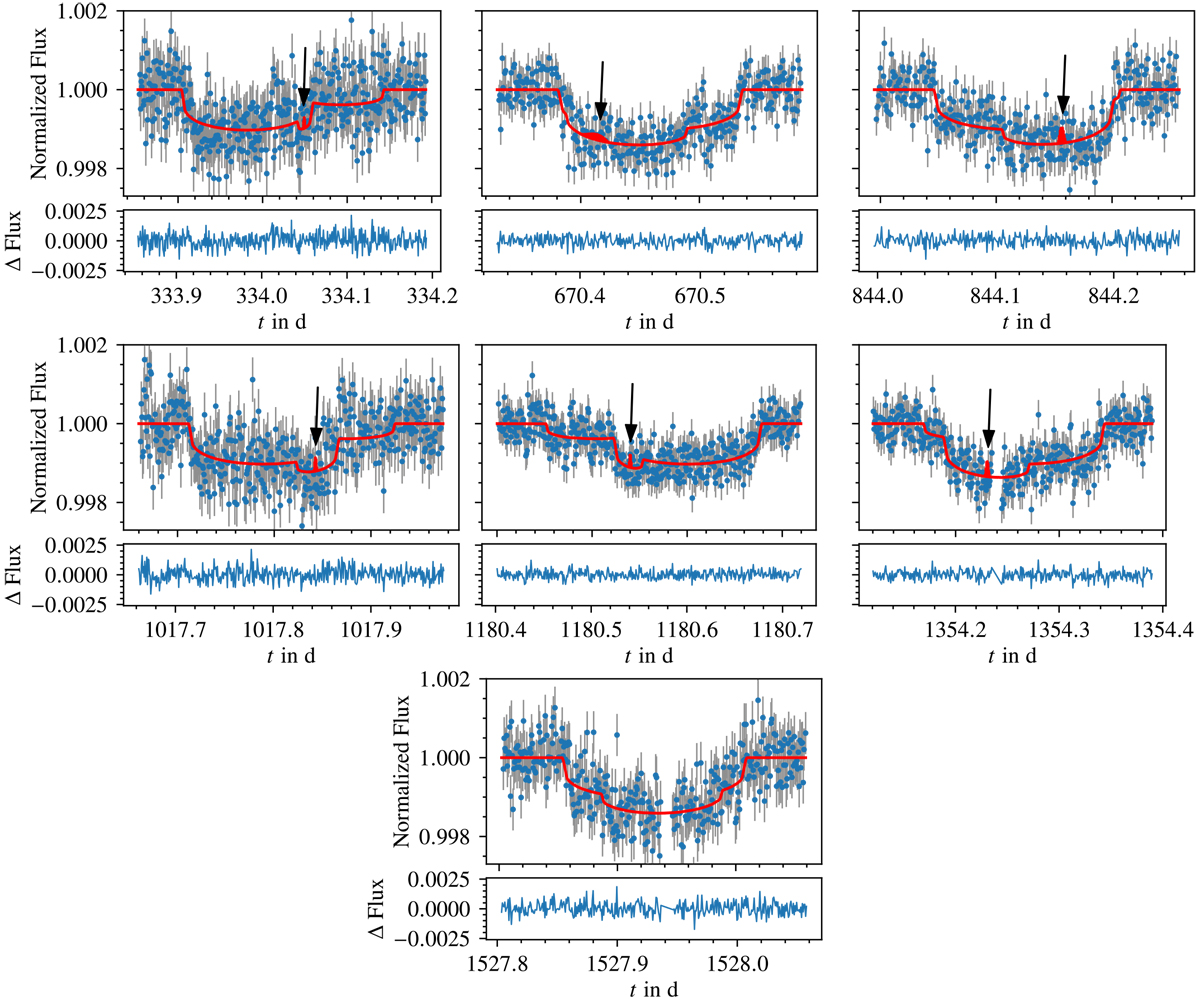
Multiple transits of Kepler-20 b + c (dots) together with our Blender models (red). The error bars indicate the 1σ error of the data taken from the FITS files. Simulated PPOs present in six out of seven transits are indicated by arrows. We plot every Blender model resulting from our set of α values on top of each other in order to visualize the variation in position of the PPOs in the transit. Below every transit, we show the residuals between the data and our Blender models for the null-hypothesis α = 0°.
Current usage metrics show cumulative count of Article Views (full-text article views including HTML views, PDF and ePub downloads, according to the available data) and Abstracts Views on Vision4Press platform.
Data correspond to usage on the plateform after 2015. The current usage metrics is available 48-96 hours after online publication and is updated daily on week days.
Initial download of the metrics may take a while.