Free Access
Fig. 3
Download original image
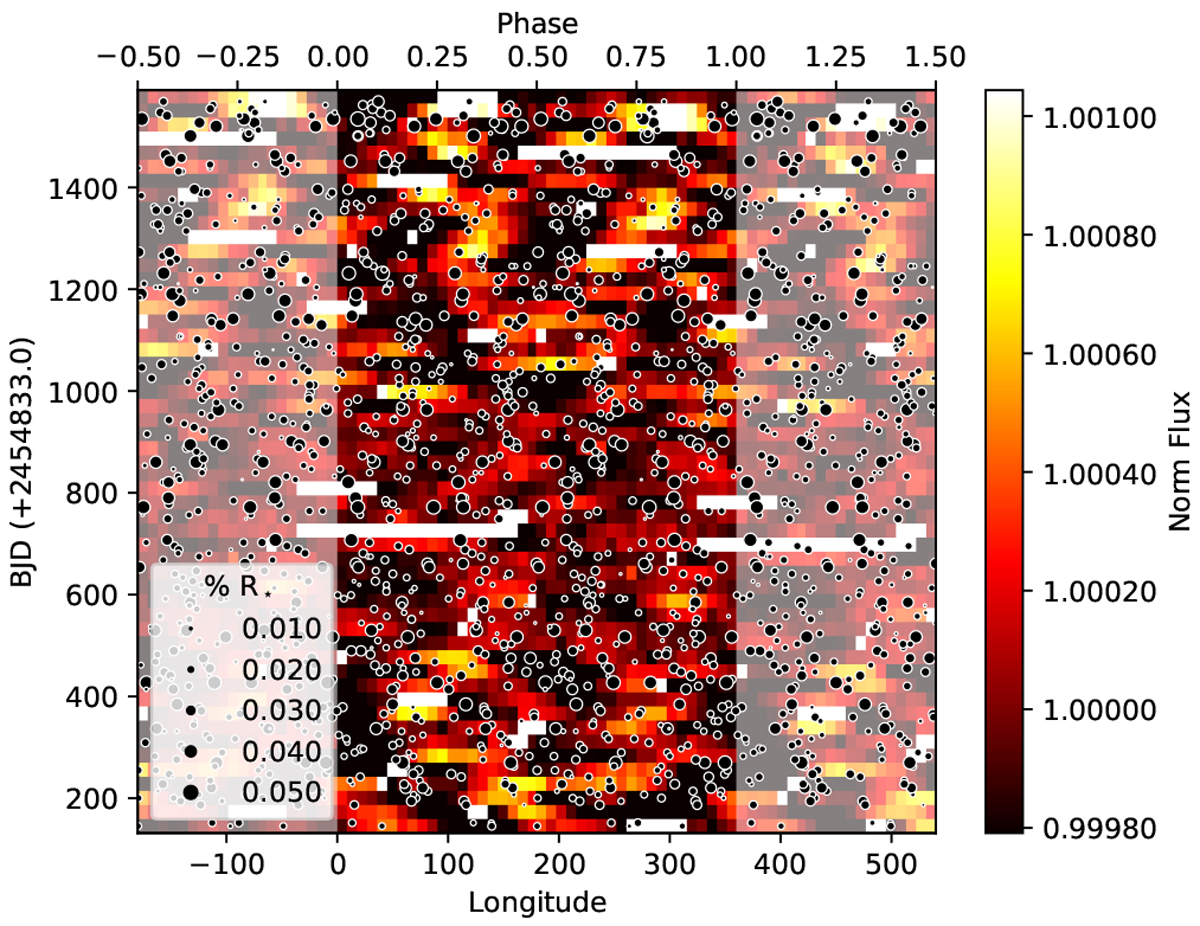
Stellar activity map of Kepler-20. Relative fluxes are color coded. Black dots show the positions and sizes of the spots. Shaded areas indicate the repeated parts of the light curve (see text for details).
Current usage metrics show cumulative count of Article Views (full-text article views including HTML views, PDF and ePub downloads, according to the available data) and Abstracts Views on Vision4Press platform.
Data correspond to usage on the plateform after 2015. The current usage metrics is available 48-96 hours after online publication and is updated daily on week days.
Initial download of the metrics may take a while.