Fig. 4.
Download original image
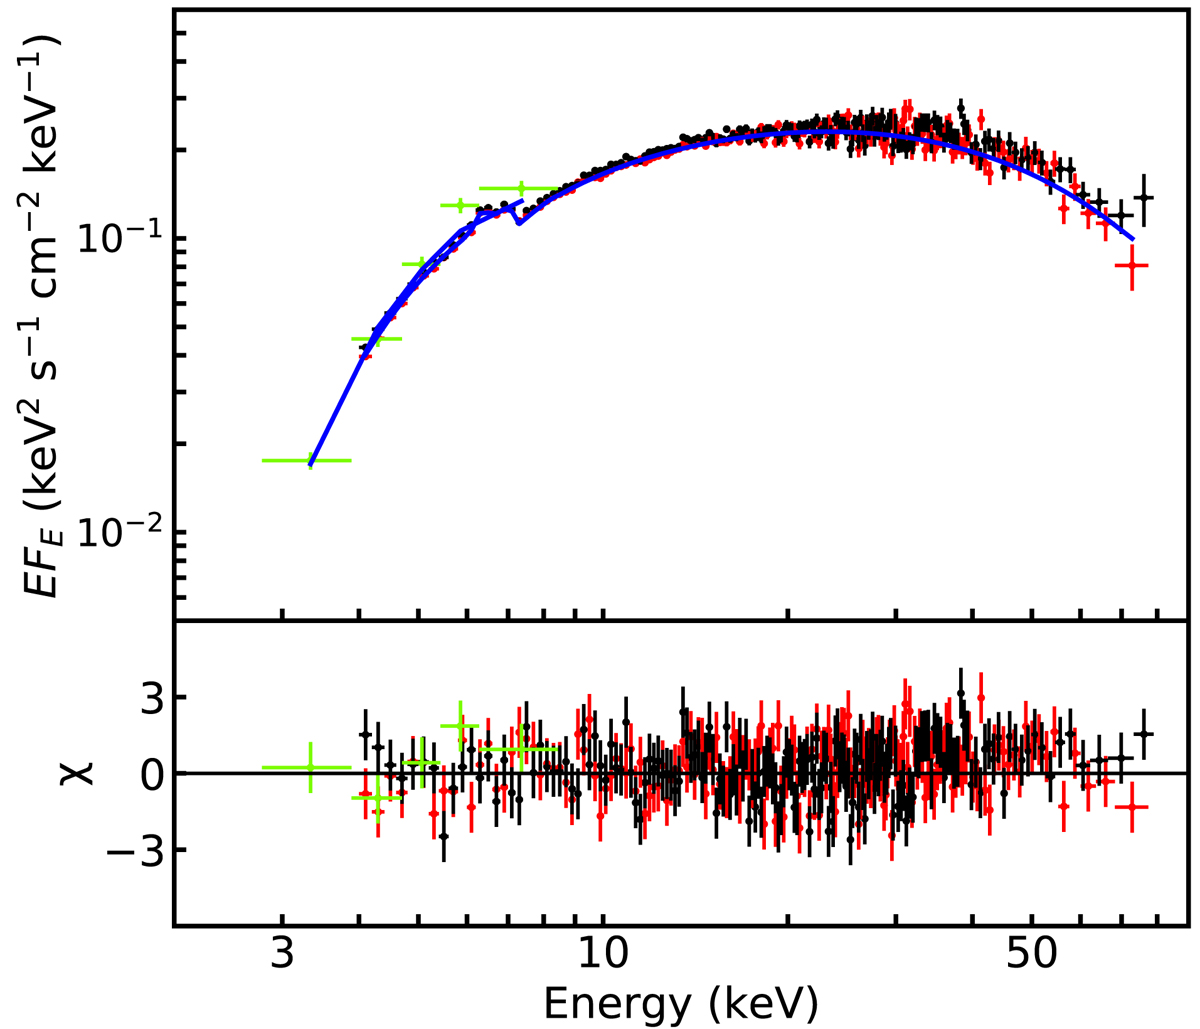
Top panel: broad band X-ray spectrum of 2S 1845−024 extracted from Swift/XRT (green crosses) and NuSTAR/FPMA and FPMB (red and black crosses). The solid blue line represents the best-fit model CONSTANT × TBABS × (PO × HIGHECUT + GAU). Bottom panel: residuals from the best-fit model in units of standard deviations. We emphasize that the Swift/XRT spectrum is obtained in the range 0.3−10 keV; however, there are not enough soft X-ray photons below 3 keV because the spectrum is highly absorbed.
Current usage metrics show cumulative count of Article Views (full-text article views including HTML views, PDF and ePub downloads, according to the available data) and Abstracts Views on Vision4Press platform.
Data correspond to usage on the plateform after 2015. The current usage metrics is available 48-96 hours after online publication and is updated daily on week days.
Initial download of the metrics may take a while.