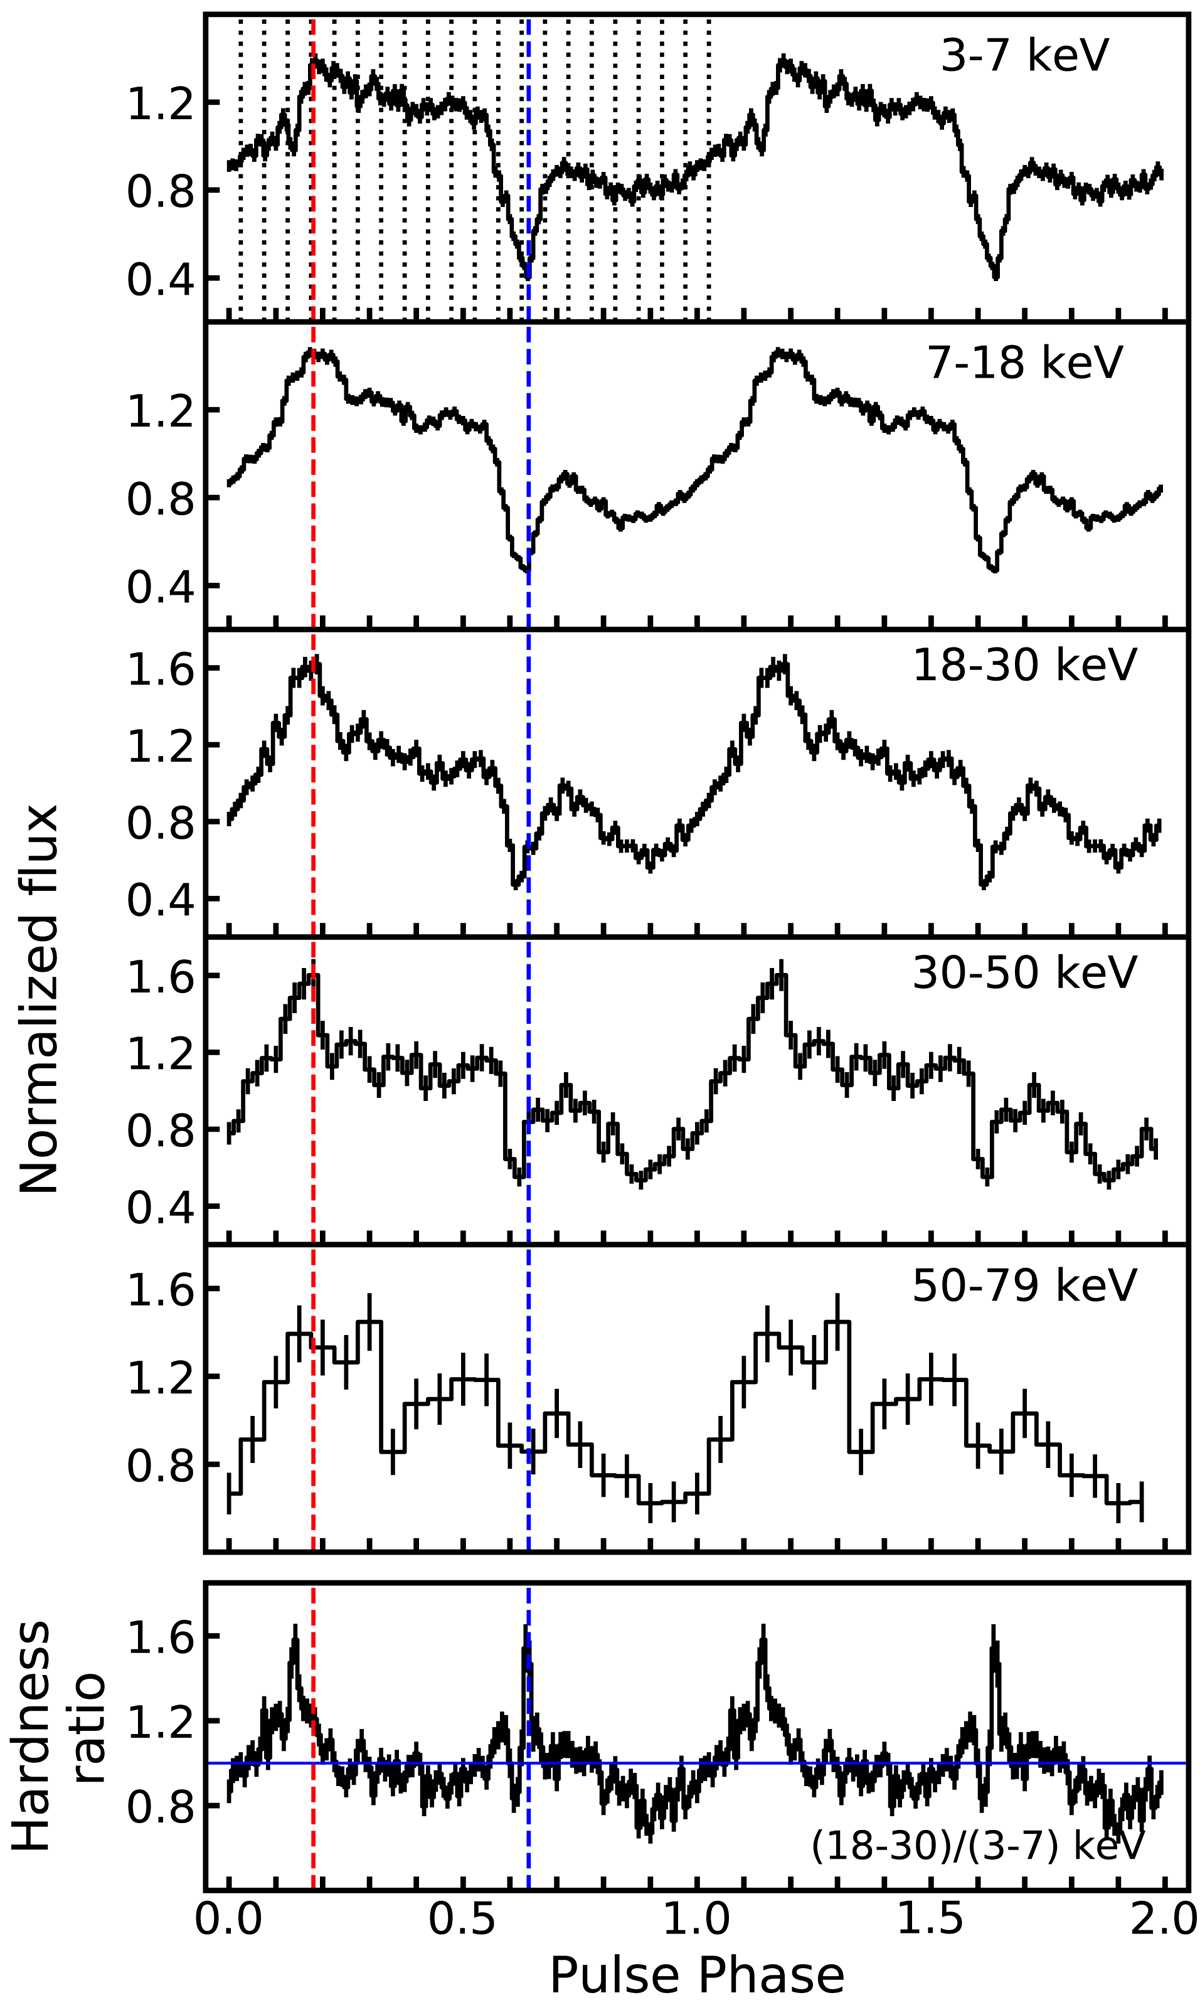
Fig. 2.
Download original image
Top panels: pulse profile of 2S 1845−024 in different energy bands obtained from the NuSTAR observation. Fluxes are normalized by the mean flux in each energy range. The red and blue dashed lines show the main maximum and minimum in the 3−7 keV band, respectively. The black dotted lines in the uppermost panel show the phase segments used to extract the phase-resolved spectra. Bottom panel: hardness ratio of the source over the pulse phase calculated as a ratio of normalized count rates in the pulse profiles in the energy bands 18−30 and 3−7 keV. The hardness ratio of unity is indicated by the horizontal blue solid line.
Current usage metrics show cumulative count of Article Views (full-text article views including HTML views, PDF and ePub downloads, according to the available data) and Abstracts Views on Vision4Press platform.
Data correspond to usage on the plateform after 2015. The current usage metrics is available 48-96 hours after online publication and is updated daily on week days.
Initial download of the metrics may take a while.