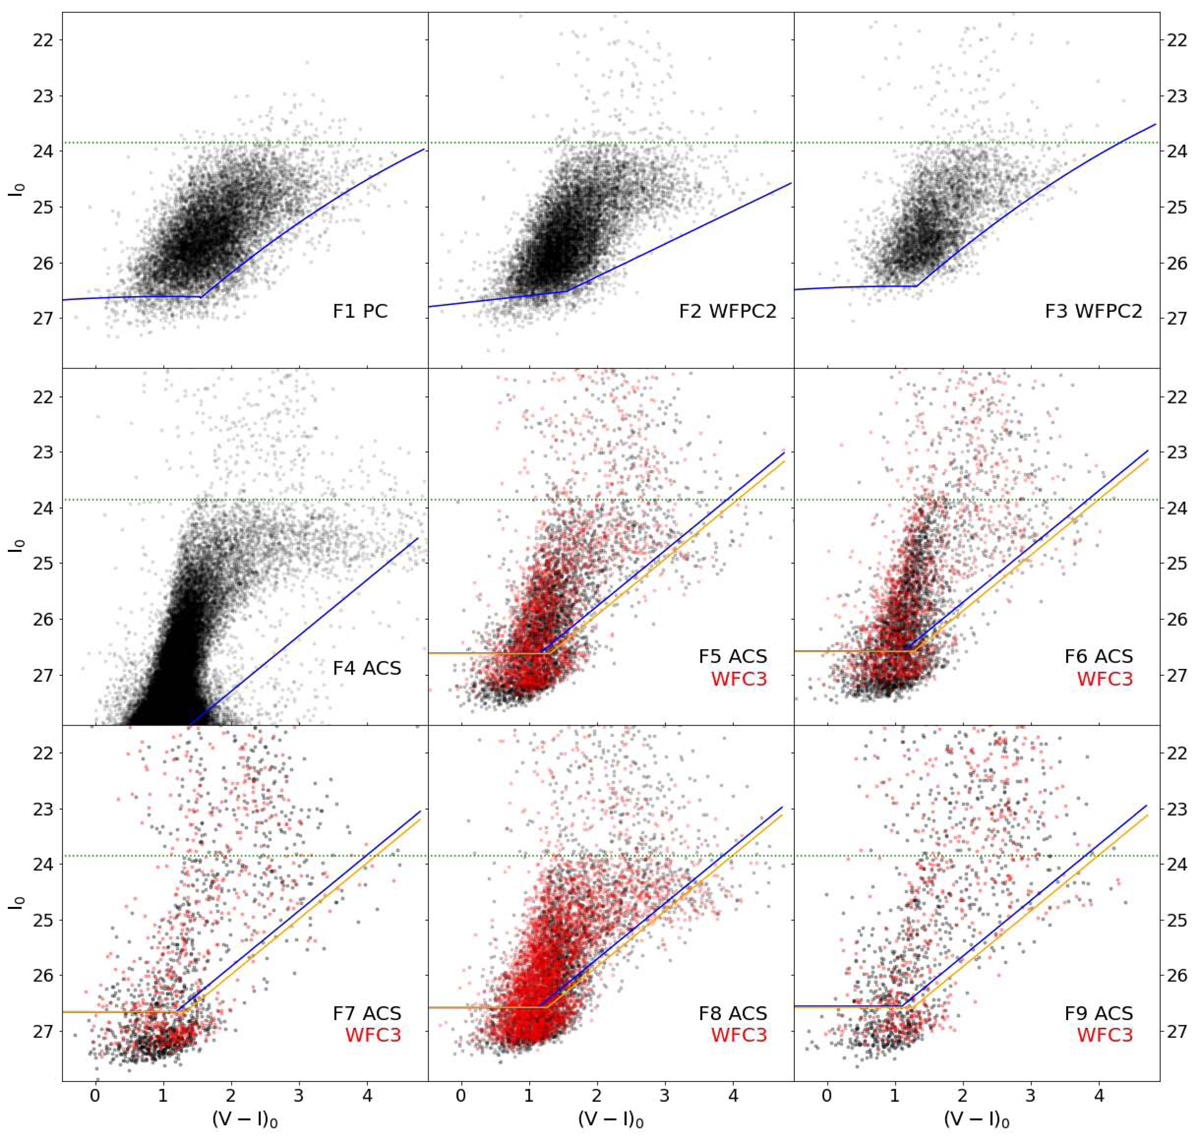
Fig. 4.
Download original image
Measured CMDs for fields F1–F9 as listed in Table 1, including the correction for Galactic extinction. The older data for locations at 8, 20, and 30 kpc (F1, F2, and F3) were taken with the WFPC2 camera. For the fields F5 to F9, data from ACS pointings are plotted as black dots and from WFC3 as red dots. The solid lines show the 50% detection completeness levels (ACS and WFPC2 in blue, and WFC3 in orange). The dotted green line indicates the expected location of the TRGB. For F4, the photometric limits are much deeper than for the other fields.
Current usage metrics show cumulative count of Article Views (full-text article views including HTML views, PDF and ePub downloads, according to the available data) and Abstracts Views on Vision4Press platform.
Data correspond to usage on the plateform after 2015. The current usage metrics is available 48-96 hours after online publication and is updated daily on week days.
Initial download of the metrics may take a while.