Fig. 3.
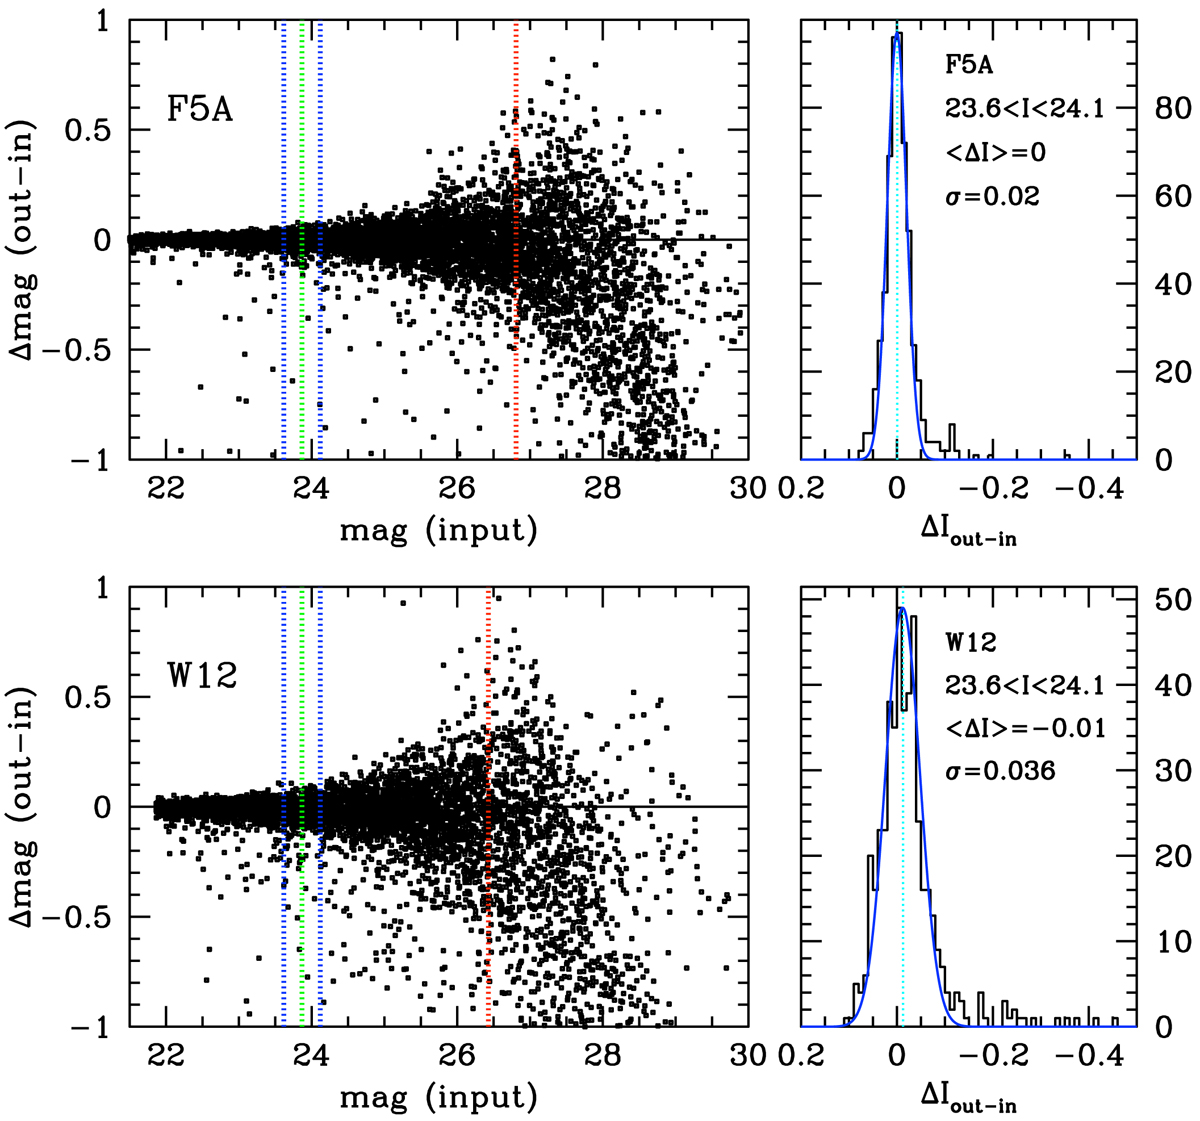
Download original image
Sample of photometric measurement precision for Field F5A (top) and W12 (bottom panels) for the I band. The magnitude difference Δ(m) (measured – input) for 10 000 input artificial stars is plotted against input magnitude for F5A (upper left) and W12 (lower left panel). The 50% detection completeness levels are marked with the vertical dotted red lines. The dotted green line is the magnitude of the TRGB. The blue lines indicate ±0.25 mag around the TRGB. Right panels: distributions of magnitude differences (measured – input) for stars within ±0.25 mag of the TRGB, binned to 0.01 mag for F5A (upper right) and W12 (lower right panel). The Gaussian curves plotted over the magnitude difference histograms have the mean and sigma as indicated in the panels.
Current usage metrics show cumulative count of Article Views (full-text article views including HTML views, PDF and ePub downloads, according to the available data) and Abstracts Views on Vision4Press platform.
Data correspond to usage on the plateform after 2015. The current usage metrics is available 48-96 hours after online publication and is updated daily on week days.
Initial download of the metrics may take a while.